| Red | Green | Blue | |
| z | 17.64 | ||
| znorm | Inf | ||
| sky | -Inf | -Inf | -Inf |
| S/N | 25.9 | 44.3 | 47.9 |
| S/N(c) | 0.0 | 0.0 | 0.0 |
| SN(E/C) |


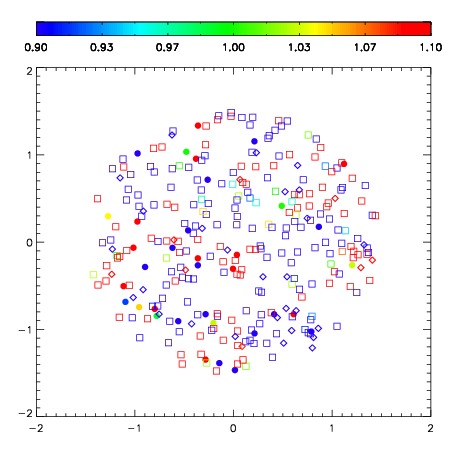
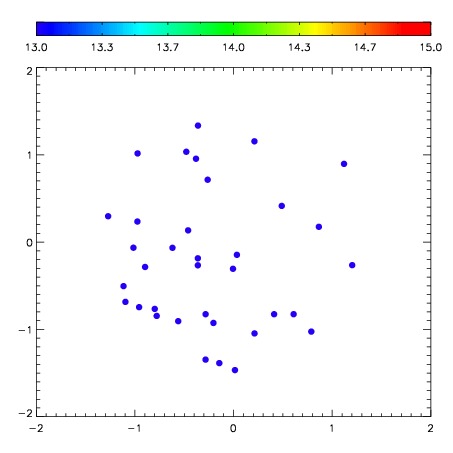
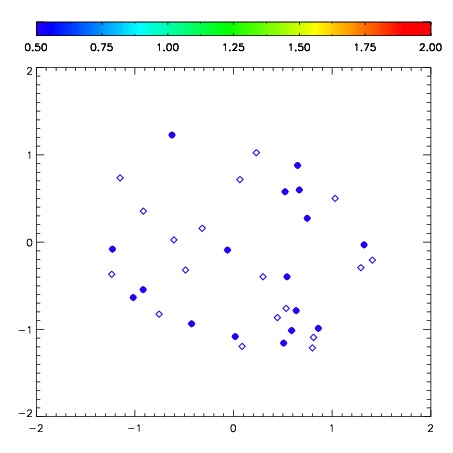
| Frame | Nreads | Zeropoints | Mag plots | Spatial mag deviation | Spatial sky 16325A emission deviations (filled: sky, open: star) | Spatial sky continuum emission | Spatial sky telluric CO2 absorption deviations (filled: H < 10) | |||||||||||||||||||||||
| 0 | 0 |
|
|
|
|
|
|
| IPAIR | NAME | SHIFT | NEWSHIFT | S/N | NAME | SHIFT | NEWSHIFT | S/N |
| 0 | 10460049 | 0.400611 | 0.00000 | 232.820 | 10460048 | 0.00000 | 0.400611 | 232.735 |
| 1 | 10460054 | 0.392699 | 0.00791201 | 242.168 | 10460055 | 0.00556472 | 0.395046 | 245.826 |
| 2 | 10460053 | 0.393733 | 0.00687802 | 238.581 | 10460052 | 0.00602114 | 0.394590 | 238.607 |
| 3 | 10460050 | 0.387226 | 0.0133850 | 235.803 | 10460051 | 0.00876504 | 0.391846 | 238.034 |