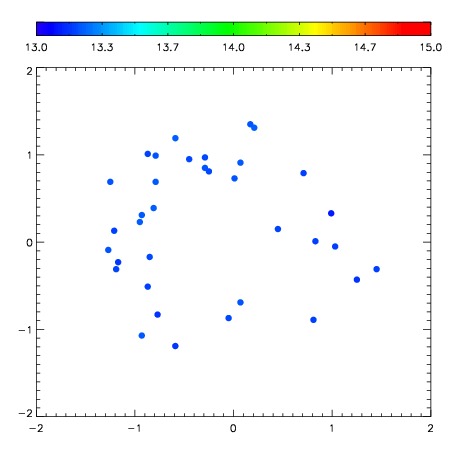
| Frame | Nreads | Zeropoints | Mag plots
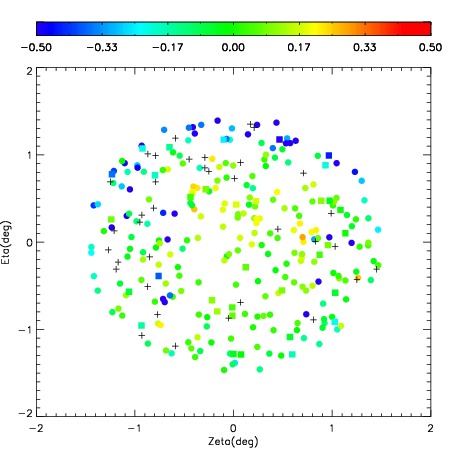
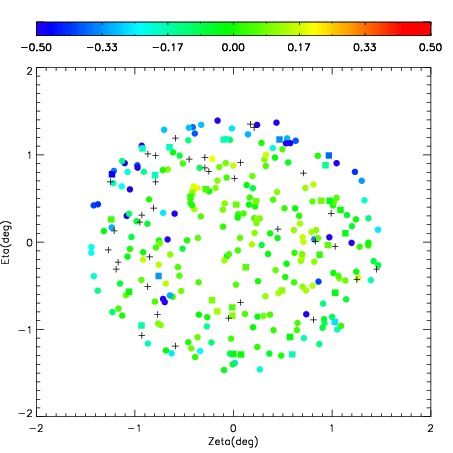
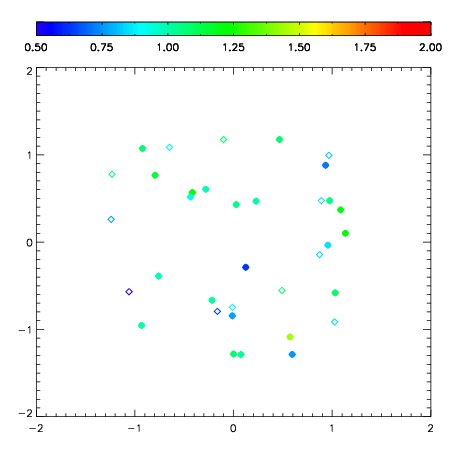
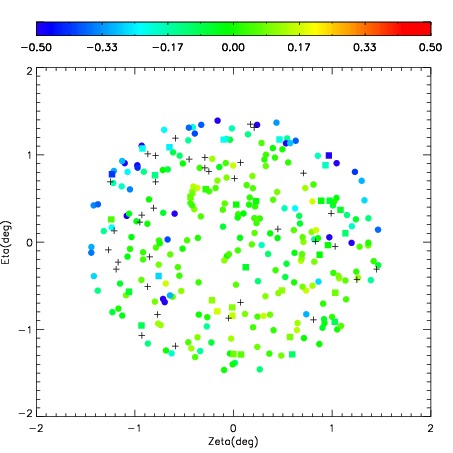
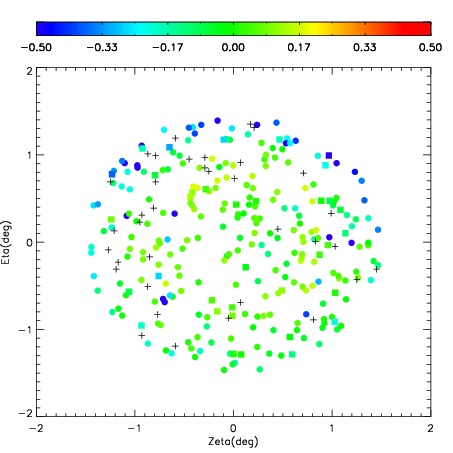
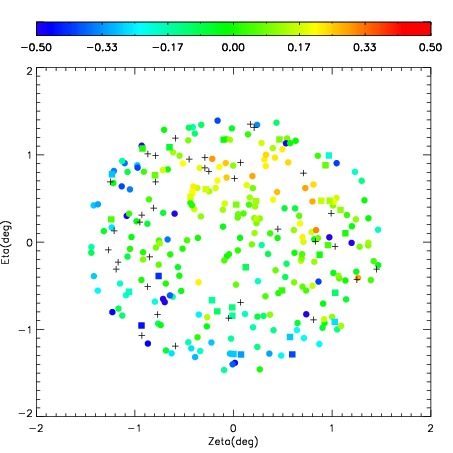
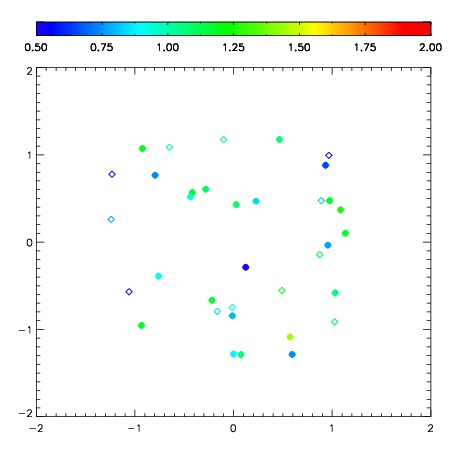
| Spatial mag deviation
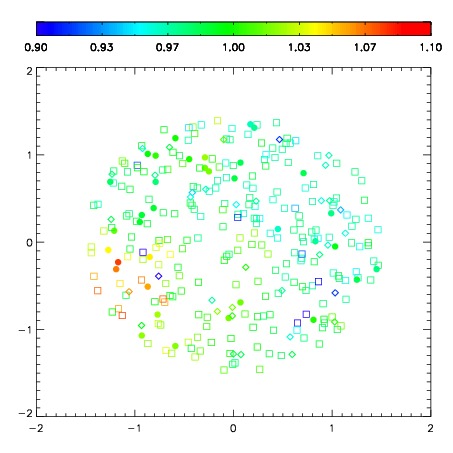
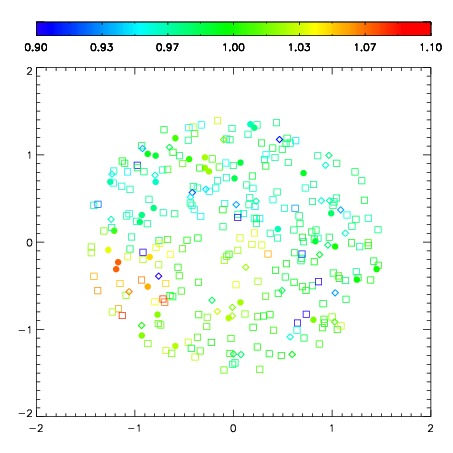
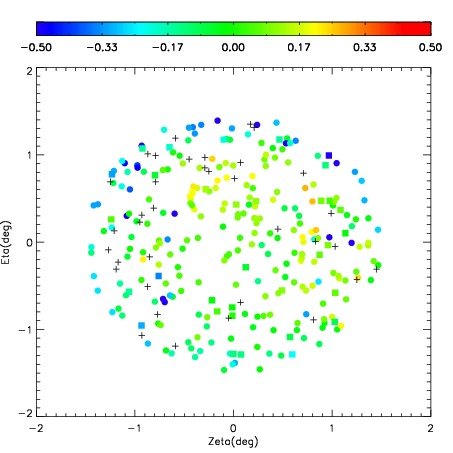
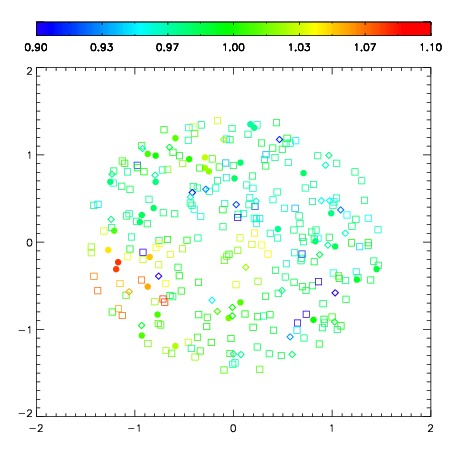
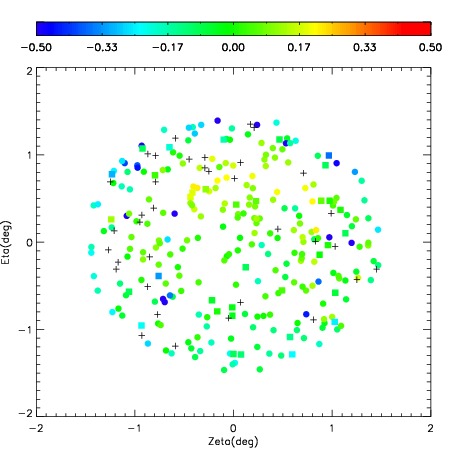
| Spatial sky 16325A emission deviations (filled: sky, open: star)
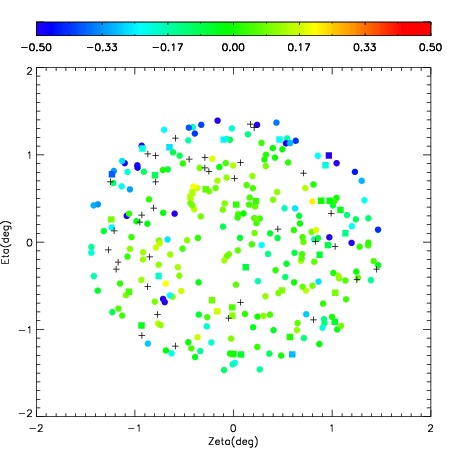
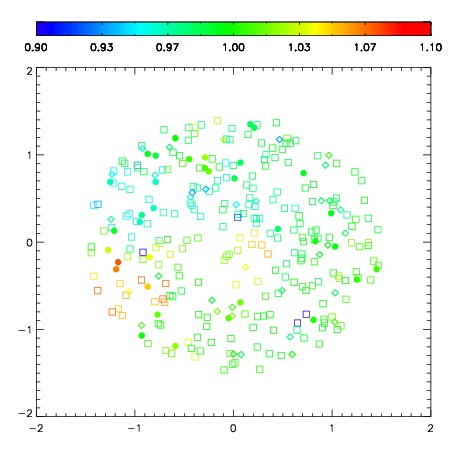
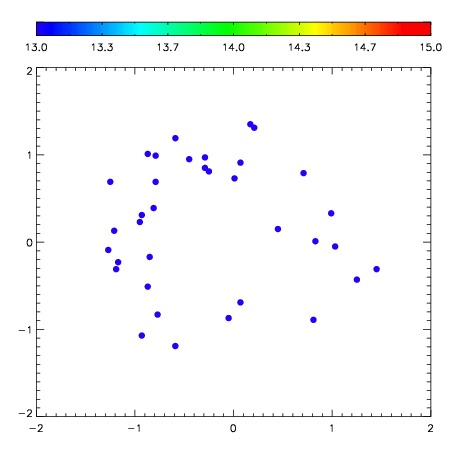
| Spatial sky continuum emission
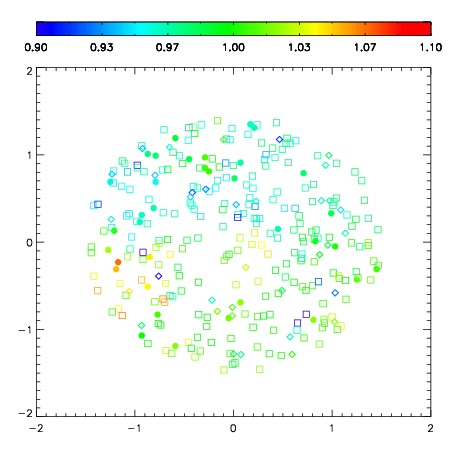
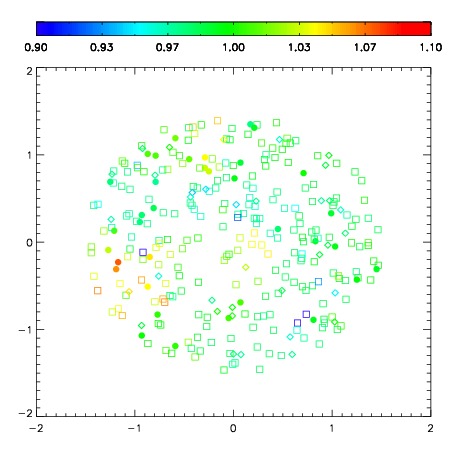
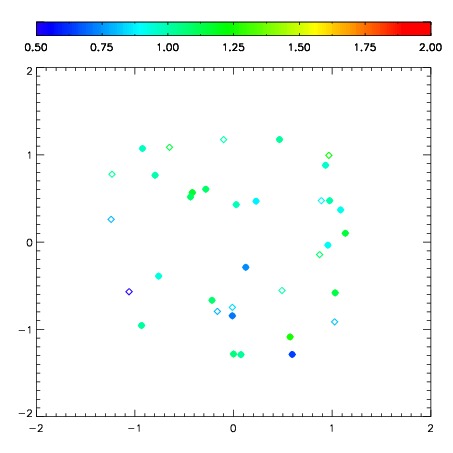
| Spatial sky telluric CO2 absorption deviations (filled: H < 10)
|
| 10540048
| 47
| | Red | Green | Blue
| | z | | 17.05
| | znorm | | 12.87
| | sky | 13.0 | 12.9 | 12.9
| | S/N | 2.6 | 4.7 | 5.6
| | S/N(c) | 2.2 | 4.2 | 5.7
| | SN(E/C) 0.80
|
| 
| 
| 
| 
| 
|
| 10540049
| 47
| | Red | Green | Blue
| | z | | 17.44
| | znorm | | 13.26
| | sky | 13.1 | 13.1 | 13.1
| | S/N | 3.8 | 6.9 | 8.1
| | S/N(c) | 3.3 | 6.2 | 7.4
| | SN(E/C) 0.66
|
| 
| 
| 
| 
| 
|
| 10540050
| 47
| | Red | Green | Blue
| | z | | 17.30
| | znorm | | 13.12
| | sky | 13.1 | 13.0 | 13.1
| | S/N | 3.4 | 6.4 | 7.1
| | S/N(c) | 3.0 | 5.8 | 6.3
| | SN(E/C) 0.72
|
| 
| 
| 
| 
| 
|
| 10540051
| 47
| | Red | Green | Blue
| | z | | 16.78
| | znorm | | 12.60
| | sky | 12.9 | 12.8 | 12.9
| | S/N | 2.1 | 4.1 | 4.5
| | S/N(c) | 1.9 | 3.8 | 4.2
| | SN(E/C) 0.85
|
| 
| 
| 
| 
| 
|
| 10540052
| 47
| | Red | Green | Blue
| | z | | 17.53
| | znorm | | 13.35
| | sky | 13.1 | 13.0 | 13.1
| | S/N | 4.1 | 7.7 | 8.4
| | S/N(c) | 3.7 | 7.0 | 7.8
| | SN(E/C) 0.66
|
| 
| 
| 
| 
| 
|
| 10540053
| 47
| | Red | Green | Blue
| | z | | 17.66
| | znorm | | 13.48
| | sky | 13.3 | 13.2 | 13.4
| | S/N | 5.2 | 9.3 | 9.9
| | S/N(c) | 4.5 | 8.2 | 9.0
| | SN(E/C) 0.63
|
| 
| 
| 
| 
| 
|
| 10540054
| 47
| | Red | Green | Blue
| | z | | 16.53
| | znorm | | 12.35
| | sky | 12.9 | 12.9 | 13.0
| | S/N | 1.8 | 3.4 | 3.9
| | S/N(c) | 1.5 | 3.0 | 3.7
| | SN(E/C) 0.83
|
| 
| 
| 
| 
| 
|
| 10540055
| 47
| | Red | Green | Blue
| | z | | 17.22
| | znorm | | 13.04
| | sky | 13.0 | 13.0 | 13.1
| | S/N | 3.2 | 6.3 | 6.7
| | S/N(c) | 2.9 | 5.3 | 6.4
| | SN(E/C) 0.71
|
| 
| 
| 
| 
| 
|