| Red | Green | Blue | |
| z | 17.64 | ||
| znorm | Inf | ||
| sky | -Inf | -Inf | -Inf |
| S/N | 6.1 | 11.4 | 12.9 |
| S/N(c) | 0.0 | 0.0 | 0.0 |
| SN(E/C) |
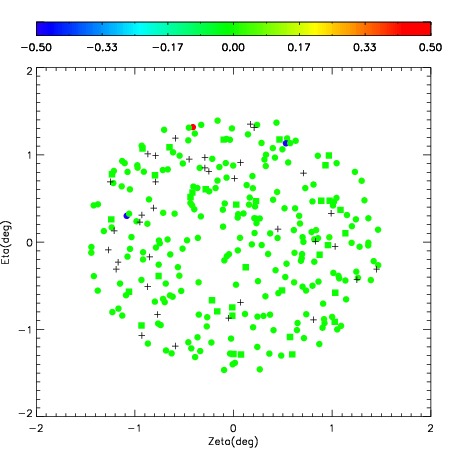
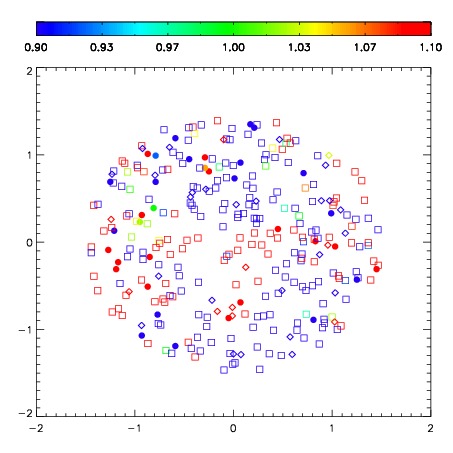
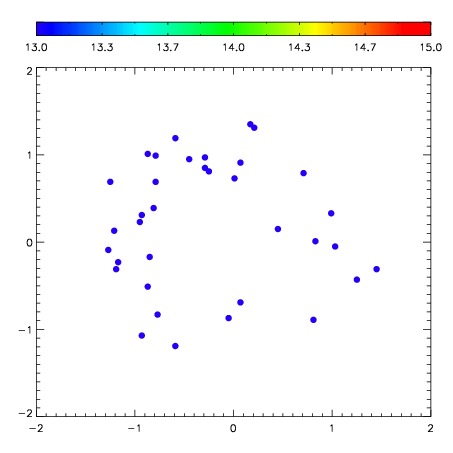
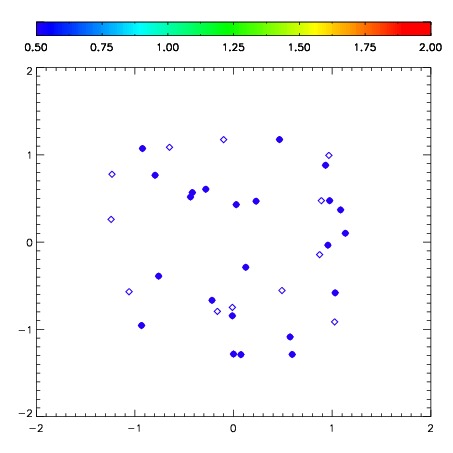
| Frame | Nreads | Zeropoints | Mag plots | Spatial mag deviation | Spatial sky 16325A emission deviations (filled: sky, open: star) | Spatial sky continuum emission | Spatial sky telluric CO2 absorption deviations (filled: H < 10) | |||||||||||||||||||||||
| 0 | 0 |
|
|
|
|
|
|
| IPAIR | NAME | SHIFT | NEWSHIFT | S/N | NAME | SHIFT | NEWSHIFT | S/N |
| 0 | 10540049 | 0.496686 | 0.00000 | 146.866 | 10540055 | 0.0199791 | 0.476707 | 136.071 |
| 1 | 10540053 | 0.485910 | 0.0107760 | 163.981 | 10540052 | 0.0245261 | 0.472160 | 152.988 |
| 2 | 10540050 | 0.494576 | 0.00211000 | 138.740 | 10540048 | 0.00000 | 0.496686 | 126.827 |
| 3 | 10540054 | 0.495831 | 0.000854999 | 97.6479 | 10540051 | 0.0273861 | 0.469300 | 111.122 |