| Red | Green | Blue | |
| z | 17.64 | ||
| znorm | Inf | ||
| sky | -Inf | -Inf | -Inf |
| S/N | 26.8 | 45.6 | 51.2 |
| S/N(c) | 0.0 | 0.0 | 0.0 |
| SN(E/C) |

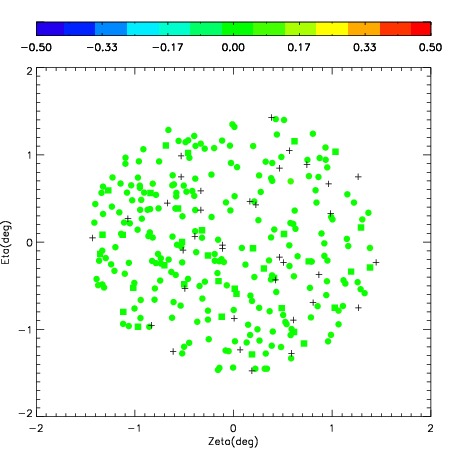
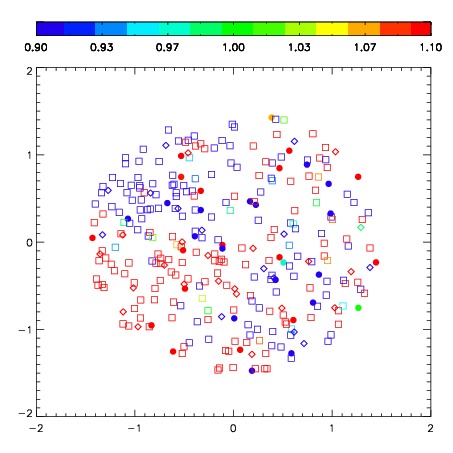
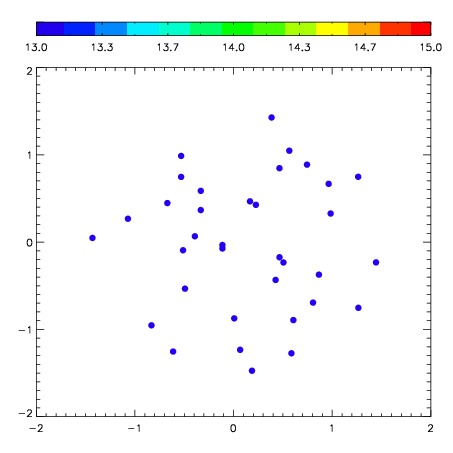
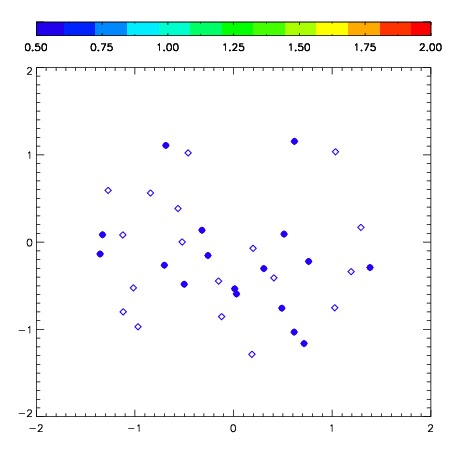
| Frame | Nreads | Zeropoints | Mag plots | Spatial mag deviation | Spatial sky 16325A emission deviations (filled: sky, open: star) | Spatial sky continuum emission | Spatial sky telluric CO2 absorption deviations (filled: H < 10) | |||||||||||||||||||||||
| 0 | 0 |
|
|
|
|
|
|
| IPAIR | NAME | SHIFT | NEWSHIFT | S/N | NAME | SHIFT | NEWSHIFT | S/N |
| 0 | 06980103 | 0.393646 | 0.00000 | 230.338 | 06980105 | -0.00832072 | 0.401967 | 229.008 |
| 1 | 06980099 | 0.388265 | 0.00538099 | 253.675 | 06980101 | -0.00538823 | 0.399034 | 248.573 |
| 2 | 06980100 | 0.386565 | 0.00708100 | 248.772 | 06980098 | 0.00000 | 0.393646 | 247.718 |
| 3 | 06980104 | 0.389643 | 0.00400299 | 231.977 | 06980102 | -0.00327329 | 0.396919 | 236.930 |