| Red | Green | Blue | |
| z | 17.64 | ||
| znorm | Inf | ||
| sky | -NaN | -NaN | -Inf |
| S/N | 17.0 | 34.1 | 36.8 |
| S/N(c) | 0.0 | 0.0 | 0.0 |
| SN(E/C) |
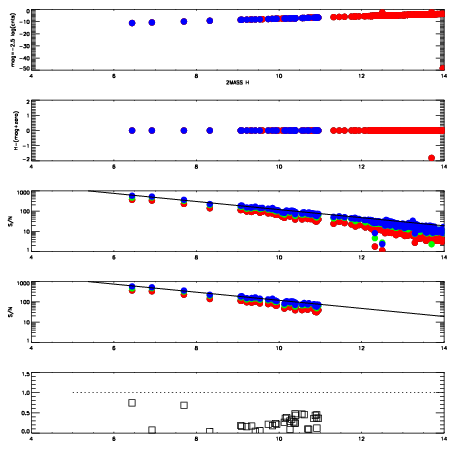
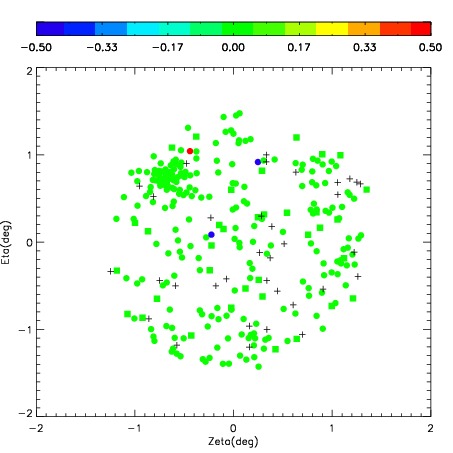


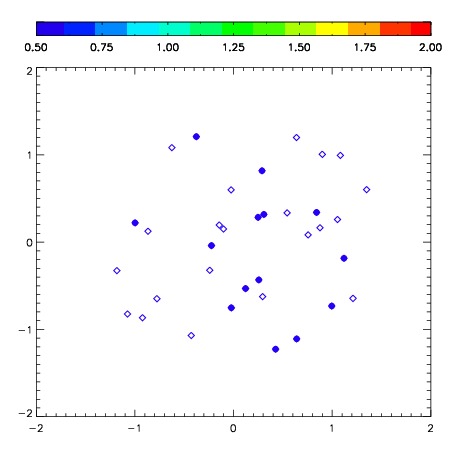
| Frame | Nreads | Zeropoints | Mag plots | Spatial mag deviation | Spatial sky 16325A emission deviations (filled: sky, open: star) | Spatial sky continuum emission | Spatial sky telluric CO2 absorption deviations (filled: H < 10) | |||||||||||||||||||||||
| 0 | 0 |
|
|
|
|
|
|
| IPAIR | NAME | SHIFT | NEWSHIFT | S/N | NAME | SHIFT | NEWSHIFT | S/N |
| 0 | 07840054 | 0.428511 | 0.00000 | 160.724 | 07840056 | -0.0224228 | 0.450934 | 150.327 |
| 1 | 07840059 | 0.419847 | 0.00866398 | 179.027 | 07840057 | -0.0264826 | 0.454994 | 168.312 |
| 2 | 07840058 | 0.424790 | 0.00372100 | 175.747 | 07840060 | -0.0256613 | 0.454172 | 167.609 |
| 3 | 07840055 | 0.410289 | 0.0182220 | 148.585 | 07840053 | 0.00000 | 0.428511 | 149.620 |