| Red | Green | Blue | |
| z | 17.63 | ||
| znorm | Inf | ||
| sky | -NaN | -NaN | -Inf |
| S/N | 26.6 | 50.1 | 57.3 |
| S/N(c) | 0.0 | 0.0 | 0.0 |
| SN(E/C) |
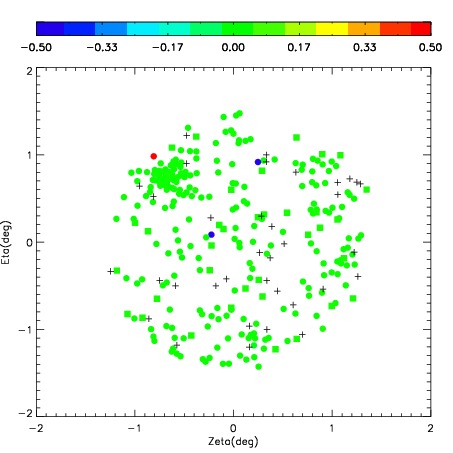
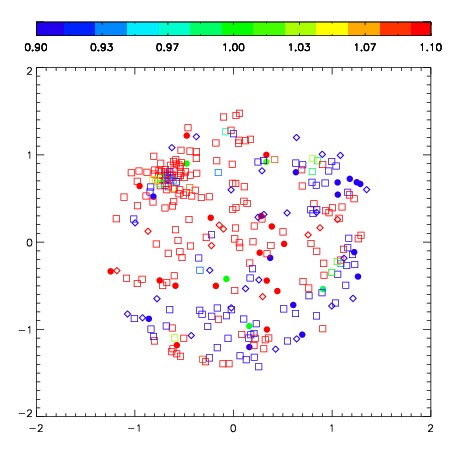
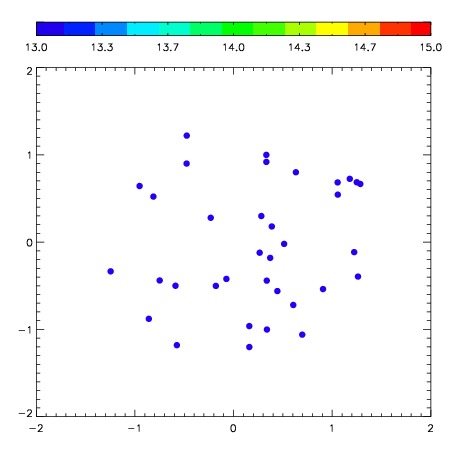
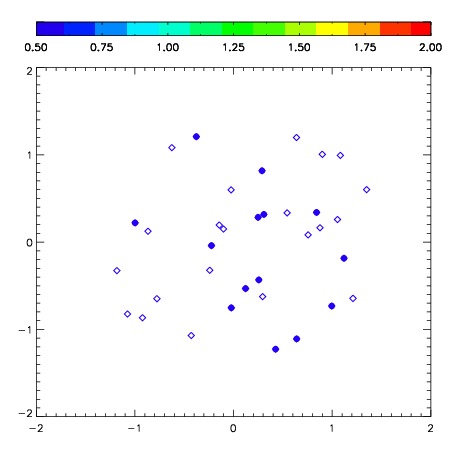
| Frame | Nreads | Zeropoints | Mag plots | Spatial mag deviation | Spatial sky 16325A emission deviations (filled: sky, open: star) | Spatial sky continuum emission | Spatial sky telluric CO2 absorption deviations (filled: H < 10) | |||||||||||||||||||||||
| 0 | 0 |
|
|
|
|
|
|
| IPAIR | NAME | SHIFT | NEWSHIFT | S/N | NAME | SHIFT | NEWSHIFT | S/N |
| 0 | 07890061 | 0.518779 | 0.00000 | 215.167 | 07890063 | 0.0384209 | 0.480358 | 212.273 |
| 1 | 07890068 | 0.492120 | 0.0266590 | 220.486 | 07890066 | 0.0340367 | 0.484742 | 214.210 |
| 2 | 07890065 | 0.492605 | 0.0261740 | 214.038 | 07890067 | 0.0414401 | 0.477339 | 208.694 |
| 3 | 07890064 | 0.497770 | 0.0210090 | 213.262 | 07890062 | 0.0265107 | 0.492268 | 206.980 |
| 4 | 07890060 | 0.483923 | 0.0348560 | 211.536 | 07890059 | 0.00000 | 0.518779 | 200.736 |