| Red | Green | Blue | |
| z | 17.64 | ||
| znorm | Inf | ||
| sky | -Inf | -Inf | -Inf |
| S/N | 24.0 | 42.9 | 49.5 |
| S/N(c) | 0.0 | 0.0 | 0.0 |
| SN(E/C) |

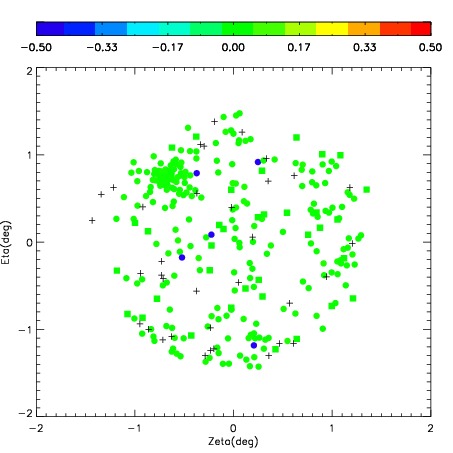

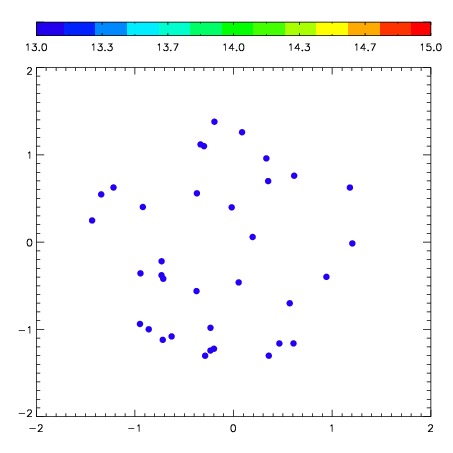
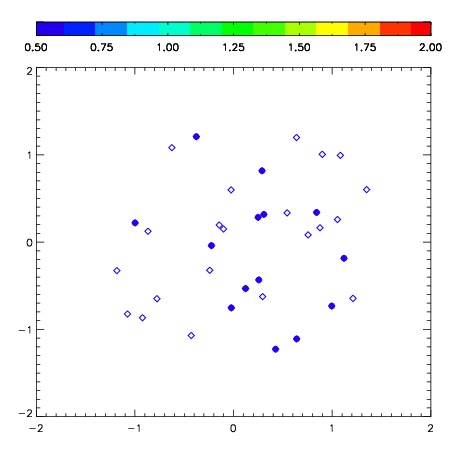
| Frame | Nreads | Zeropoints | Mag plots | Spatial mag deviation | Spatial sky 16325A emission deviations (filled: sky, open: star) | Spatial sky continuum emission | Spatial sky telluric CO2 absorption deviations (filled: H < 10) | |||||||||||||||||||||||
| 0 | 0 |
|
|
|
|
|
|
| IPAIR | NAME | SHIFT | NEWSHIFT | S/N | NAME | SHIFT | NEWSHIFT | S/N |
| 0 | 07620050 | 0.576026 | 0.00000 | 181.425 | 07620052 | 0.0774372 | 0.498589 | 172.873 |
| 1 | 07620054 | 0.569026 | 0.00700003 | 188.610 | 07620055 | 0.0740714 | 0.501955 | 200.022 |
| 2 | 07620049 | 0.570762 | 0.00526404 | 186.560 | 07620051 | 0.0846238 | 0.491402 | 192.206 |
| 3 | 07620053 | 0.561107 | 0.0149190 | 174.592 | 07620048 | 0.00000 | 0.576026 | 170.453 |