| Red | Green | Blue | |
| z | 17.64 | ||
| znorm | Inf | ||
| sky | -NaN | -Inf | -Inf |
| S/N | 24.6 | 44.1 | 47.6 |
| S/N(c) | 0.0 | 0.0 | 0.0 |
| SN(E/C) |

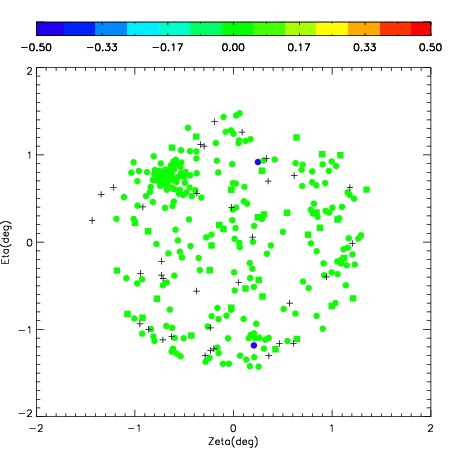
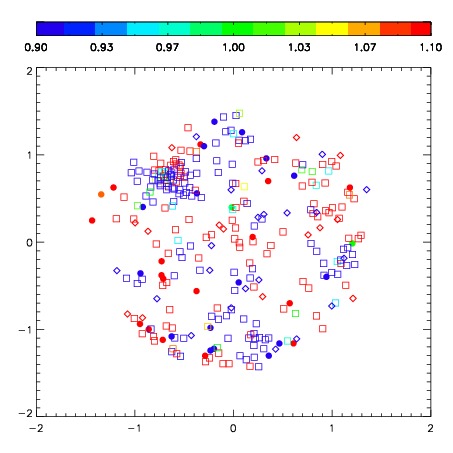

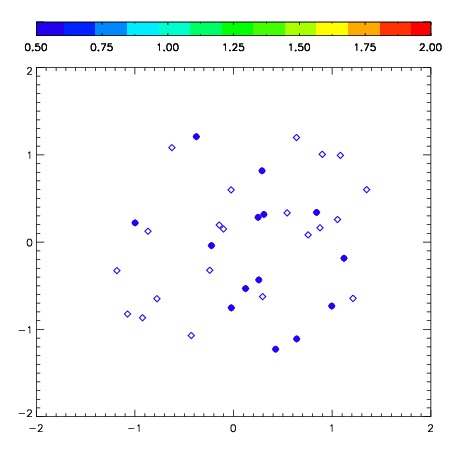
| Frame | Nreads | Zeropoints | Mag plots | Spatial mag deviation | Spatial sky 16325A emission deviations (filled: sky, open: star) | Spatial sky continuum emission | Spatial sky telluric CO2 absorption deviations (filled: H < 10) | |||||||||||||||||||||||
| 0 | 0 |
|
|
|
|
|
|
| IPAIR | NAME | SHIFT | NEWSHIFT | S/N | NAME | SHIFT | NEWSHIFT | S/N |
| 0 | 07900050 | 0.532381 | 0.00000 | 208.115 | 07900051 | 0.0523615 | 0.480020 | 203.306 |
| 1 | 07900049 | 0.527407 | 0.00497401 | 203.461 | 07900048 | 0.00000 | 0.532381 | 196.571 |
| 2 | 07900054 | 0.529845 | 0.00253600 | 195.122 | 07900052 | 0.0687774 | 0.463604 | 195.230 |
| 3 | 07900053 | 0.524645 | 0.00773603 | 192.039 | 07900055 | 0.0633398 | 0.469041 | 188.067 |