| Red | Green | Blue | |
| z | 17.64 | ||
| znorm | Inf | ||
| sky | -Inf | -Inf | -Inf |
| S/N | 14.9 | 27.9 | 27.8 |
| S/N(c) | 0.0 | 0.0 | 0.0 |
| SN(E/C) |
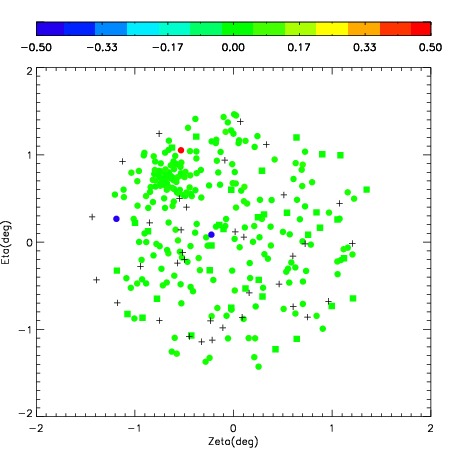
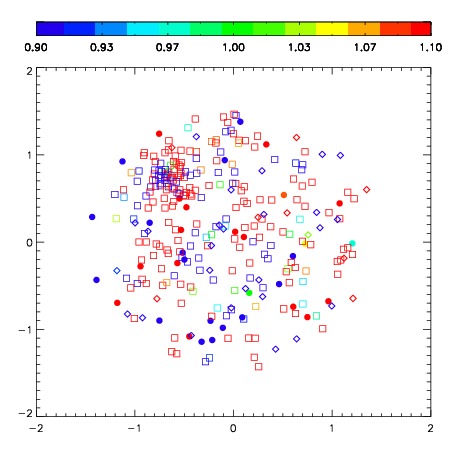
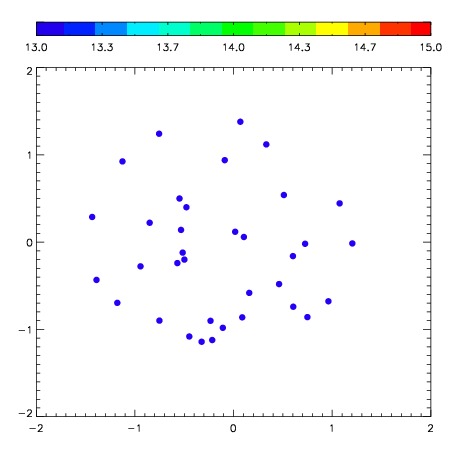
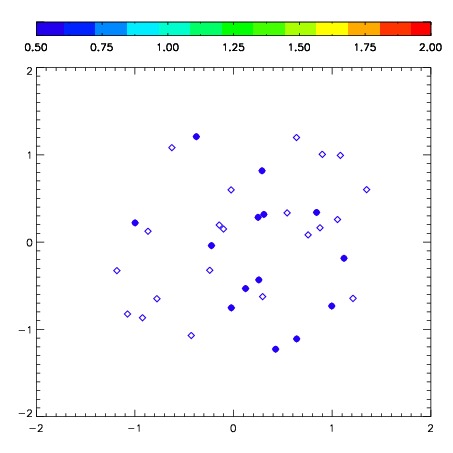
| Frame | Nreads | Zeropoints | Mag plots | Spatial mag deviation | Spatial sky 16325A emission deviations (filled: sky, open: star) | Spatial sky continuum emission | Spatial sky telluric CO2 absorption deviations (filled: H < 10) | |||||||||||||||||||||||
| 0 | 0 |
|
|
|
|
|
|
| IPAIR | NAME | SHIFT | NEWSHIFT | S/N | NAME | SHIFT | NEWSHIFT | S/N |
| 0 | 08130044 | 0.543457 | 0.00000 | 135.677 | 08130038 | 0.00000 | 0.543457 | 144.772 |
| 1 | 08130040 | 0.511745 | 0.0317120 | 149.649 | 08130045 | 0.0487057 | 0.494751 | 152.308 |
| 2 | 08130043 | 0.541039 | 0.00241798 | 139.132 | 08130041 | 0.0384212 | 0.505036 | 146.354 |
| 3 | 08130039 | 0.524588 | 0.0188690 | 133.905 | 08130042 | 0.0523668 | 0.491090 | 132.548 |