| Red | Green | Blue | |
| z | 17.64 | ||
| znorm | Inf | ||
| sky | -Inf | -Inf | -Inf |
| S/N | 19.3 | 32.1 | 33.1 |
| S/N(c) | 0.0 | 0.0 | 0.0 |
| SN(E/C) |


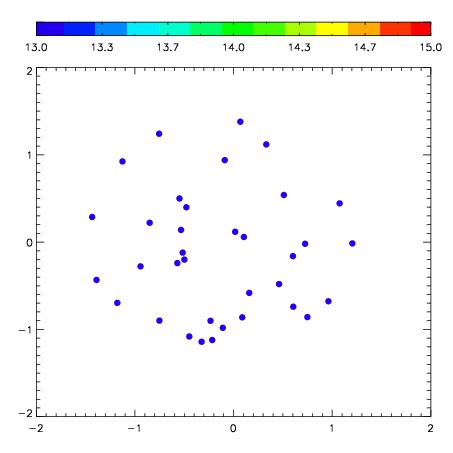
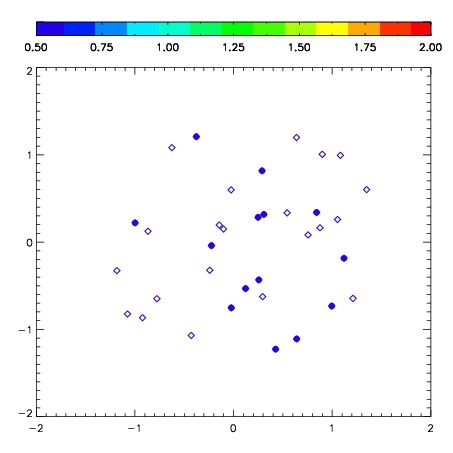
| Frame | Nreads | Zeropoints | Mag plots | Spatial mag deviation | Spatial sky 16325A emission deviations (filled: sky, open: star) | Spatial sky continuum emission | Spatial sky telluric CO2 absorption deviations (filled: H < 10) | |||||||||||||||||||||||
| 0 | 0 |
|
|
|
|
|
|
| IPAIR | NAME | SHIFT | NEWSHIFT | S/N | NAME | SHIFT | NEWSHIFT | S/N |
| 0 | 08190053 | 1.37641 | 0.00000 | 191.404 | 08190049 | 0.889274 | 0.487136 | 216.187 |
| 1 | 08190050 | 1.23542 | 0.140990 | 197.498 | 08190047 | 0.00000 | 1.37641 | 219.625 |
| 2 | 08190054 | 1.22981 | 0.146600 | 189.900 | 08190048 | 0.850519 | 0.525891 | 215.608 |
| 3 | 08190051 | 1.25725 | 0.119160 | 182.801 | 08190052 | 0.855308 | 0.521102 | 193.643 |