| Red | Green | Blue | |
| z | 17.64 | ||
| znorm | Inf | ||
| sky | -Inf | -Inf | -Inf |
| S/N | 3.5 | 6.8 | 8.6 |
| S/N(c) | 0.0 | 0.0 | 0.0 |
| SN(E/C) |

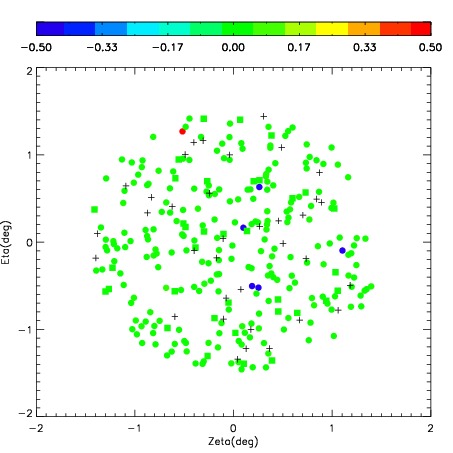
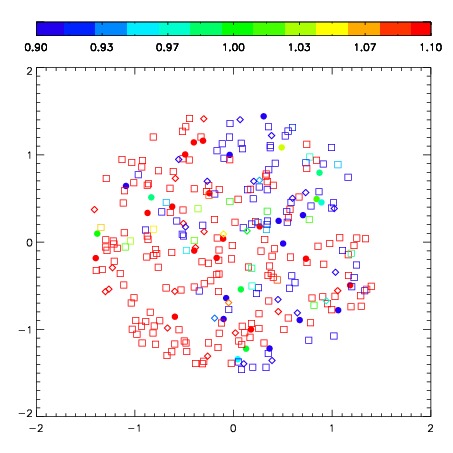
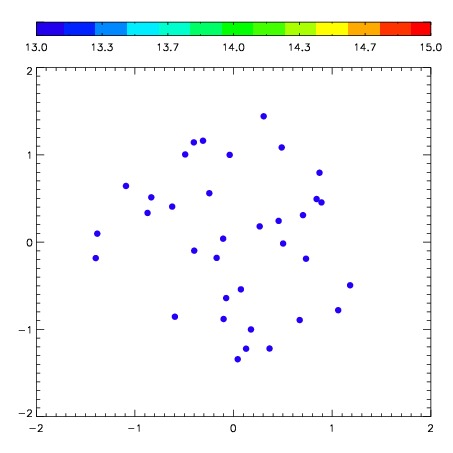
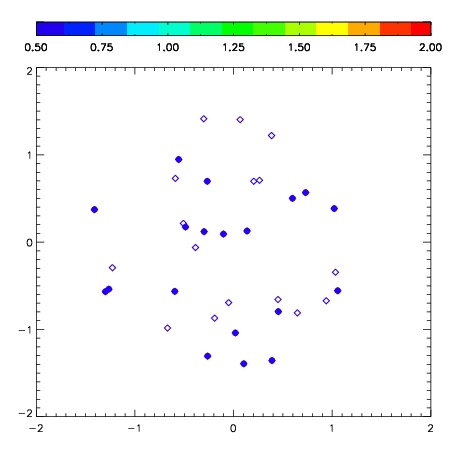
| Frame | Nreads | Zeropoints | Mag plots | Spatial mag deviation | Spatial sky 16325A emission deviations (filled: sky, open: star) | Spatial sky continuum emission | Spatial sky telluric CO2 absorption deviations (filled: H < 10) | |||||||||||||||||||||||
| 0 | 0 |
|
|
|
|
|
|
| IPAIR | NAME | SHIFT | NEWSHIFT | S/N | NAME | SHIFT | NEWSHIFT | S/N |
| 0 | 07230080 | 0.439384 | 0.00000 | 46.8671 | 07230077 | -0.00964826 | 0.449032 | 69.2572 |
| 1 | 07230075 | 0.375854 | 0.0635300 | 195.948 | 07230074 | 0.00000 | 0.439384 | 104.247 |
| 2 | 07230076 | 0.411646 | 0.0277380 | 126.428 | 07230078 | -0.00647482 | 0.445859 | 69.3729 |
| 3 | 07230079 | 0.437614 | 0.00177002 | 27.9711 | 07230081 | -0.0154440 | 0.454828 | 52.5493 |