| Red | Green | Blue | |
| z | 17.64 | ||
| znorm | Inf | ||
| sky | -NaN | -Inf | -Inf |
| S/N | 16.8 | 29.8 | 31.6 |
| S/N(c) | 0.0 | 0.0 | 0.0 |
| SN(E/C) |


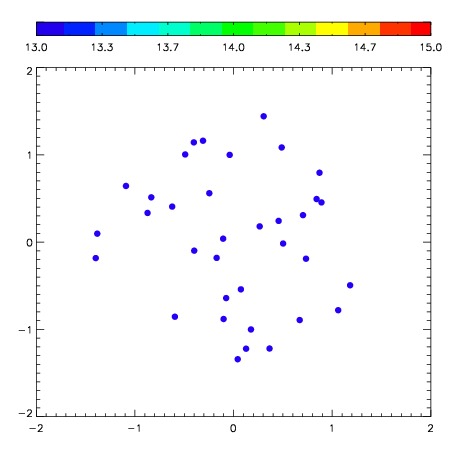
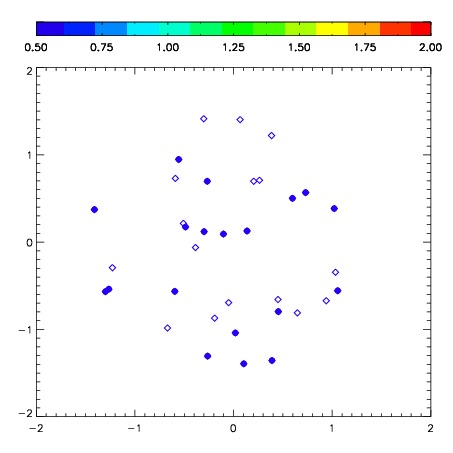
| Frame | Nreads | Zeropoints | Mag plots | Spatial mag deviation | Spatial sky 16325A emission deviations (filled: sky, open: star) | Spatial sky continuum emission | Spatial sky telluric CO2 absorption deviations (filled: H < 10) | |||||||||||||||||||||||
| 0 | 0 |
|
|
|
|
|
|
| IPAIR | NAME | SHIFT | NEWSHIFT | S/N | NAME | SHIFT | NEWSHIFT | S/N |
| 0 | 07610054 | 0.297521 | 0.00000 | 222.611 | 07610055 | -0.00144947 | 0.298970 | 225.120 |
| 1 | 07610049 | 0.266632 | 0.0308890 | 262.357 | 07610051 | 0.00701890 | 0.290502 | 260.708 |
| 2 | 07610050 | 0.271791 | 0.0257300 | 253.675 | 07610048 | 0.00000 | 0.297521 | 255.103 |
| 3 | 07610053 | 0.292045 | 0.00547600 | 242.143 | 07610052 | 0.00490065 | 0.292620 | 243.180 |