| Red | Green | Blue | |
| z | 17.64 | ||
| znorm | Inf | ||
| sky | -Inf | -Inf | -Inf |
| S/N | 20.9 | 34.9 | 37.9 |
| S/N(c) | 0.0 | 0.0 | 0.0 |
| SN(E/C) |

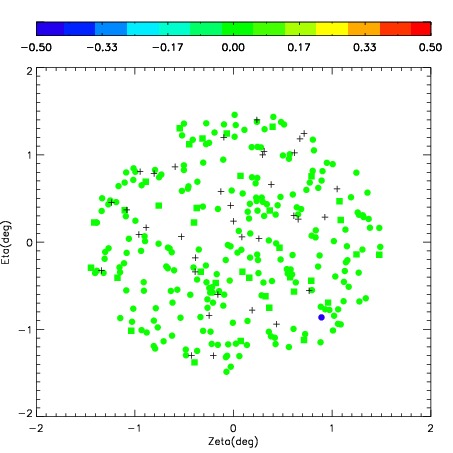
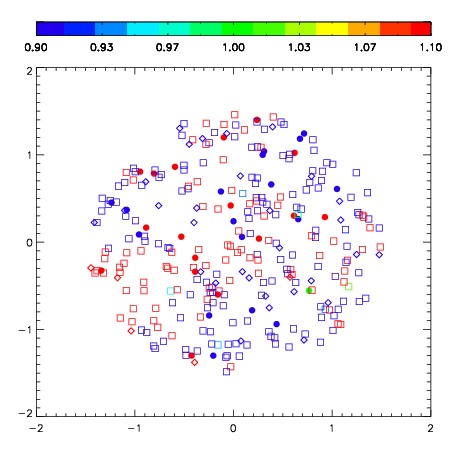


| Frame | Nreads | Zeropoints | Mag plots | Spatial mag deviation | Spatial sky 16325A emission deviations (filled: sky, open: star) | Spatial sky continuum emission | Spatial sky telluric CO2 absorption deviations (filled: H < 10) | |||||||||||||||||||||||
| 0 | 0 |
|
|
|
|
|
|
| IPAIR | NAME | SHIFT | NEWSHIFT | S/N | NAME | SHIFT | NEWSHIFT | S/N |
| 0 | 07620028 | 0.304859 | 0.00000 | 216.116 | 07620030 | -0.0175110 | 0.322370 | 232.952 |
| 1 | 07620031 | 0.272580 | 0.0322790 | 258.929 | 07620033 | -0.0128888 | 0.317748 | 242.871 |
| 2 | 07620032 | 0.289513 | 0.0153460 | 250.336 | 07620026 | 0.00000 | 0.304859 | 234.890 |
| 3 | 07620027 | 0.295916 | 0.00894302 | 214.908 | 07620029 | -0.0194967 | 0.324356 | 209.785 |