| Red | Green | Blue | |
| z | 17.64 | ||
| znorm | Inf | ||
| sky | -NaN | -NaN | -Inf |
| S/N | 25.6 | 42.2 | 46.5 |
| S/N(c) | 0.0 | 0.0 | 0.0 |
| SN(E/C) |

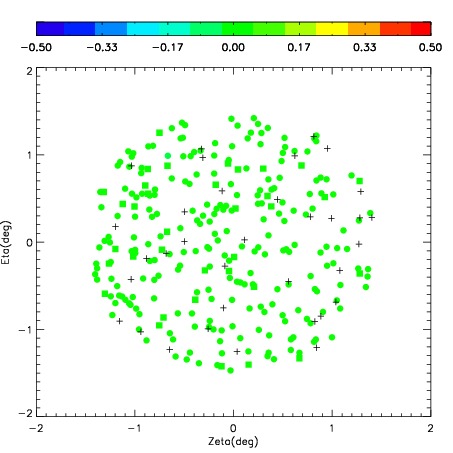
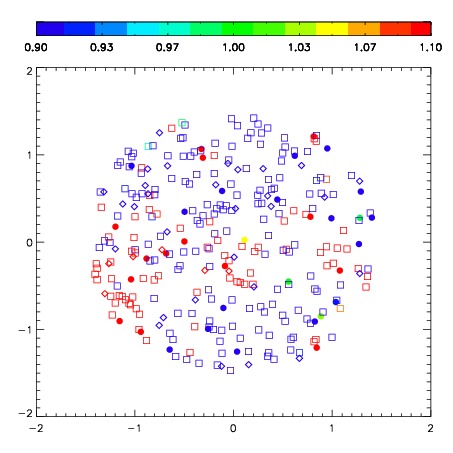


| Frame | Nreads | Zeropoints | Mag plots | Spatial mag deviation | Spatial sky 16325A emission deviations (filled: sky, open: star) | Spatial sky continuum emission | Spatial sky telluric CO2 absorption deviations (filled: H < 10) | |||||||||||||||||||||||
| 0 | 0 |
|
|
|
|
|
|
| IPAIR | NAME | SHIFT | NEWSHIFT | S/N | NAME | SHIFT | NEWSHIFT | S/N |
| 0 | 08190016 | 0.298387 | 0.00000 | 266.978 | 08190017 | -0.0359771 | 0.334364 | 260.918 |
| 1 | 08190011 | 0.282802 | 0.0155850 | 280.405 | 08190010 | 0.00000 | 0.298387 | 282.357 |
| 2 | 08190012 | 0.281493 | 0.0168940 | 278.364 | 08190013 | -0.0309831 | 0.329370 | 279.559 |
| 3 | 08190015 | 0.294817 | 0.00356999 | 270.883 | 08190014 | -0.0359364 | 0.334323 | 273.608 |