| Red | Green | Blue | |
| z | 17.64 | ||
| znorm | Inf | ||
| sky | -NaN | -NaN | -Inf |
| S/N | 23.0 | 39.5 | 43.2 |
| S/N(c) | 0.0 | 0.0 | 0.0 |
| SN(E/C) |

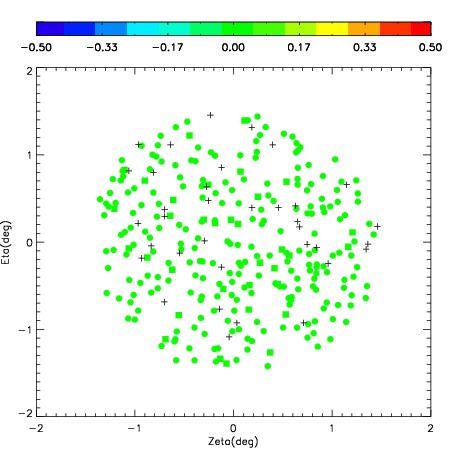
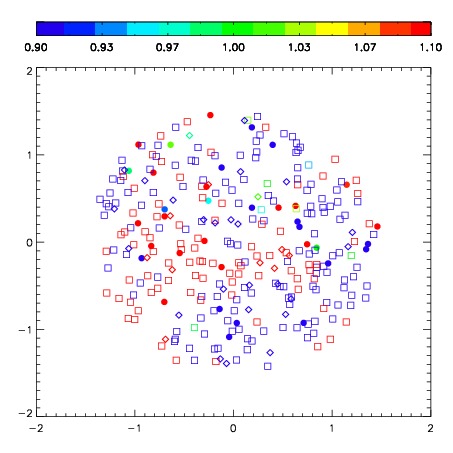
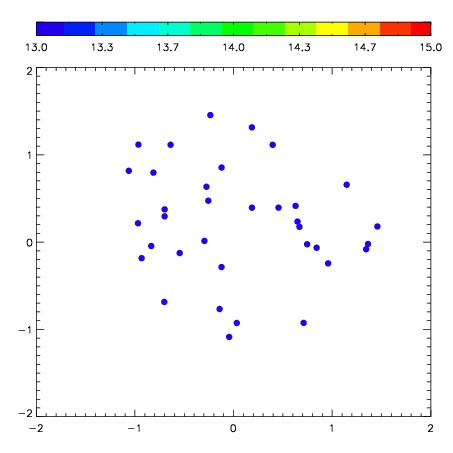
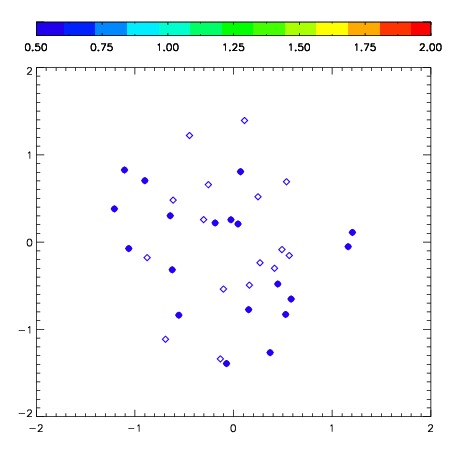
| Frame | Nreads | Zeropoints | Mag plots | Spatial mag deviation | Spatial sky 16325A emission deviations (filled: sky, open: star) | Spatial sky continuum emission | Spatial sky telluric CO2 absorption deviations (filled: H < 10) | |||||||||||||||||||||||
| 0 | 0 |
|
|
|
|
|
|
| IPAIR | NAME | SHIFT | NEWSHIFT | S/N | NAME | SHIFT | NEWSHIFT | S/N |
| 0 | 07220074 | 0.378011 | 0.00000 | 239.826 | 07220072 | 0.00000 | 0.378011 | 190.558 |
| 1 | 07220078 | 0.374460 | 0.00355098 | 267.345 | 07220075 | 0.00282623 | 0.375185 | 267.577 |
| 2 | 07220077 | 0.372832 | 0.00517899 | 264.267 | 07220079 | 0.00462145 | 0.373390 | 261.006 |
| 3 | 07220081 | 0.372744 | 0.00526699 | 257.703 | 07220080 | 0.00461350 | 0.373397 | 257.004 |
| 4 | 07220073 | 0.373419 | 0.00459200 | 248.300 | 07220076 | 0.00337510 | 0.374636 | 235.510 |