| Red | Green | Blue | |
| z | 17.64 | ||
| znorm | Inf | ||
| sky | -NaN | -Inf | -Inf |
| S/N | 22.5 | 36.8 | 41.9 |
| S/N(c) | 0.0 | 0.0 | 0.0 |
| SN(E/C) |


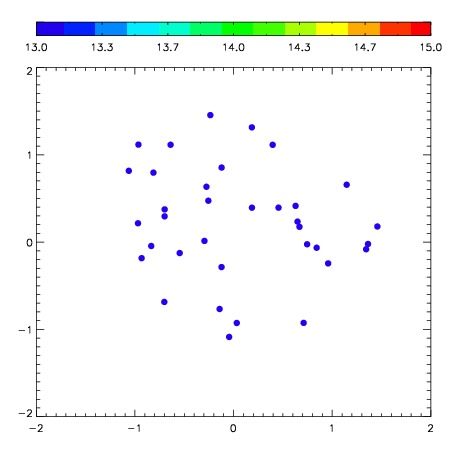

| Frame | Nreads | Zeropoints | Mag plots | Spatial mag deviation | Spatial sky 16325A emission deviations (filled: sky, open: star) | Spatial sky continuum emission | Spatial sky telluric CO2 absorption deviations (filled: H < 10) | |||||||||||||||||||||||
| 0 | 0 |
|
|
|
|
|
|
| IPAIR | NAME | SHIFT | NEWSHIFT | S/N | NAME | SHIFT | NEWSHIFT | S/N |
| 0 | 07530063 | 0.377130 | 0.00000 | 288.954 | 07530064 | 0.00958180 | 0.367548 | 287.171 |
| 1 | 07530062 | 0.374518 | 0.00261199 | 305.262 | 07530061 | 0.00000 | 0.377130 | 301.374 |
| 2 | 07530067 | 0.373937 | 0.00319299 | 292.579 | 07530068 | 0.00724304 | 0.369887 | 300.010 |
| 3 | 07530066 | 0.373962 | 0.00316802 | 286.098 | 07530065 | 0.00890268 | 0.368227 | 281.046 |