| Red | Green | Blue | |
| z | 17.64 | ||
| znorm | Inf | ||
| sky | -NaN | -Inf | -Inf |
| S/N | 18.6 | 35.9 | 38.2 |
| S/N(c) | 0.0 | 0.0 | 0.0 |
| SN(E/C) |

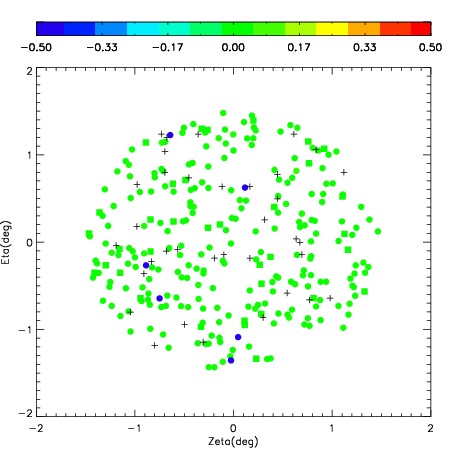

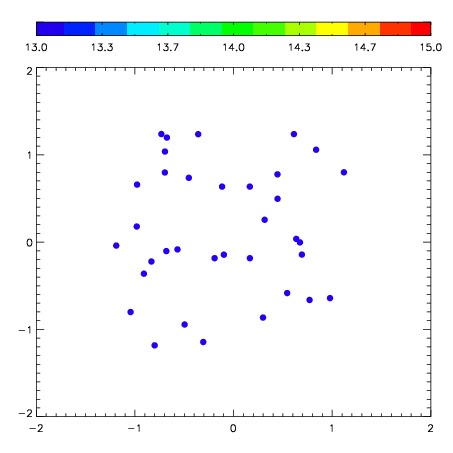
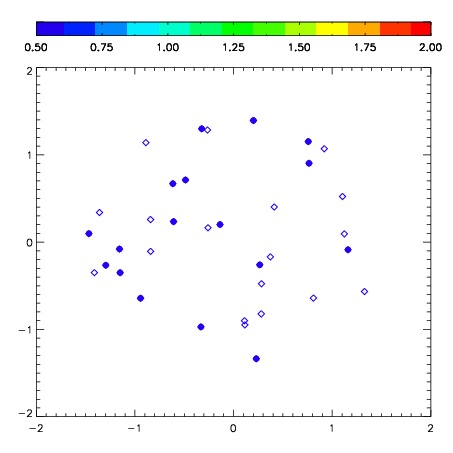
| Frame | Nreads | Zeropoints | Mag plots | Spatial mag deviation | Spatial sky 16325A emission deviations (filled: sky, open: star) | Spatial sky continuum emission | Spatial sky telluric CO2 absorption deviations (filled: H < 10) | |||||||||||||||||||||||
| 0 | 0 |
|
|
|
|
|
|
| IPAIR | NAME | SHIFT | NEWSHIFT | S/N | NAME | SHIFT | NEWSHIFT | S/N |
| 0 | 07260110 | 0.363619 | 0.00000 | 142.292 | 07260109 | -0.0125926 | 0.376212 | 156.620 |
| 1 | 07260102 | 0.316885 | 0.0467340 | 233.866 | 07260100 | -0.00595537 | 0.369574 | 225.114 |
| 2 | 07260103 | 0.307760 | 0.0558590 | 225.866 | 07260105 | -0.00983760 | 0.373457 | 223.930 |
| 3 | 07260106 | 0.317969 | 0.0456500 | 223.148 | 07260104 | -0.00521252 | 0.368832 | 222.977 |
| 4 | 07260107 | 0.319002 | 0.0446170 | 221.860 | 07260101 | -0.00245327 | 0.366072 | 220.072 |
| 5 | 07260099 | 0.316791 | 0.0468280 | 215.612 | 07260097 | 0.00000 | 0.363619 | 203.099 |
| 6 | 07260098 | 0.319289 | 0.0443300 | 204.039 | 07260108 | -0.00661665 | 0.370236 | 187.065 |