| Red | Green | Blue | |
| z | 17.64 | ||
| znorm | Inf | ||
| sky | -Inf | -Inf | -Inf |
| S/N | 20.0 | 37.1 | 40.6 |
| S/N(c) | 0.0 | 0.0 | 0.0 |
| SN(E/C) |

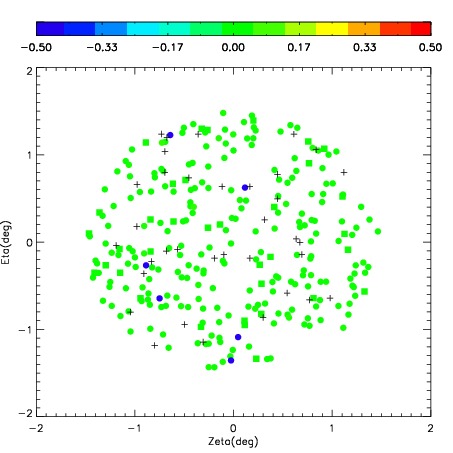
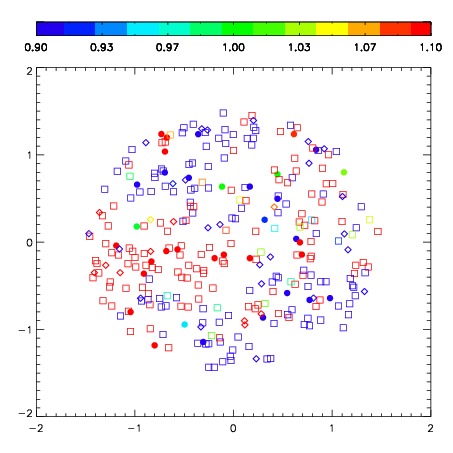

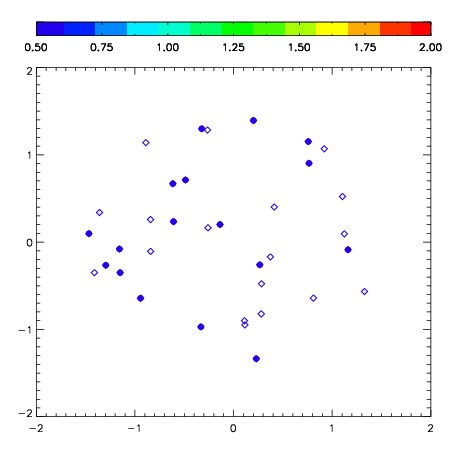
| Frame | Nreads | Zeropoints | Mag plots | Spatial mag deviation | Spatial sky 16325A emission deviations (filled: sky, open: star) | Spatial sky continuum emission | Spatial sky telluric CO2 absorption deviations (filled: H < 10) | |||||||||||||||||||||||
| 0 | 0 |
|
|
|
|
|
|
| IPAIR | NAME | SHIFT | NEWSHIFT | S/N | NAME | SHIFT | NEWSHIFT | S/N |
| 0 | 07520066 | 0.441112 | 0.00000 | 198.697 | 07520065 | 0.00000 | 0.441112 | 201.536 |
| 1 | 07520071 | 0.433690 | 0.00742200 | 216.128 | 07520072 | 0.0109988 | 0.430113 | 209.284 |
| 2 | 07520070 | 0.433726 | 0.00738600 | 210.006 | 07520069 | 0.0101672 | 0.430945 | 204.606 |
| 3 | 07520067 | 0.436381 | 0.00473100 | 198.711 | 07520068 | 0.0126865 | 0.428426 | 203.019 |