| Red | Green | Blue | |
| z | 17.64 | ||
| znorm | Inf | ||
| sky | -Inf | -Inf | -Inf |
| S/N | 17.9 | 31.9 | 34.9 |
| S/N(c) | 0.0 | 0.0 | 0.0 |
| SN(E/C) |
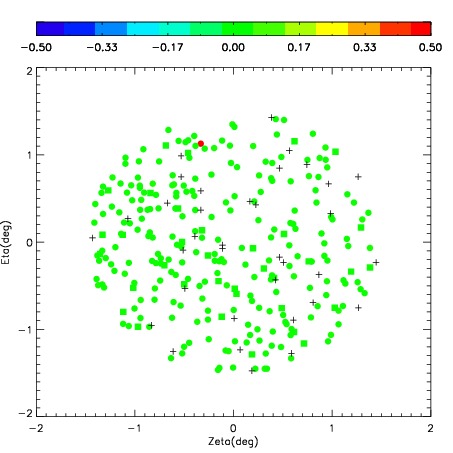

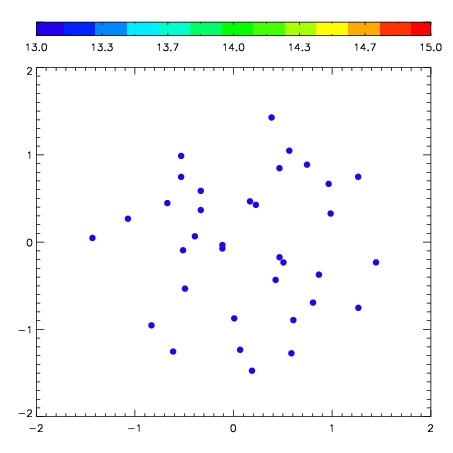
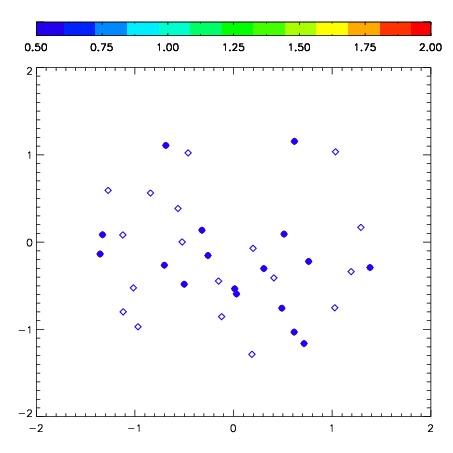
| Frame | Nreads | Zeropoints | Mag plots | Spatial mag deviation | Spatial sky 16325A emission deviations (filled: sky, open: star) | Spatial sky continuum emission | Spatial sky telluric CO2 absorption deviations (filled: H < 10) | |||||||||||||||||||||||
| 0 | 0 |
|
|
|
|
|
|
| IPAIR | NAME | SHIFT | NEWSHIFT | S/N | NAME | SHIFT | NEWSHIFT | S/N |
| 0 | 07210071 | 0.433176 | 0.00000 | 180.336 | 07210070 | 0.00000 | 0.433176 | 179.929 |
| 1 | 07210076 | 0.397078 | 0.0360980 | 278.723 | 07210074 | 0.0159018 | 0.417274 | 249.409 |
| 2 | 07210075 | 0.401364 | 0.0318120 | 273.529 | 07210077 | 0.0169070 | 0.416269 | 228.020 |
| 3 | 07210072 | 0.424983 | 0.00819302 | 217.154 | 07210073 | 0.0191539 | 0.414022 | 210.303 |