| Red | Green | Blue | |
| z | 17.64 | ||
| znorm | Inf | ||
| sky | -NaN | -Inf | -Inf |
| S/N | 24.4 | 39.0 | 41.5 |
| S/N(c) | 0.0 | 0.0 | 0.0 |
| SN(E/C) |
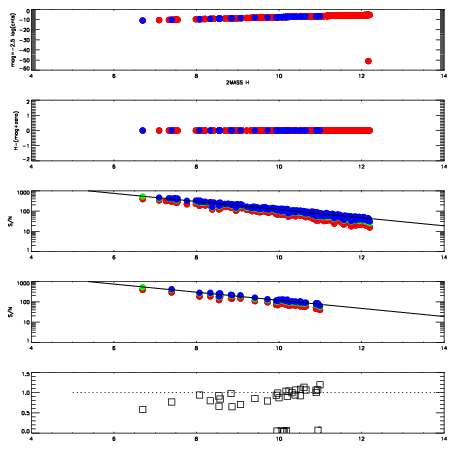
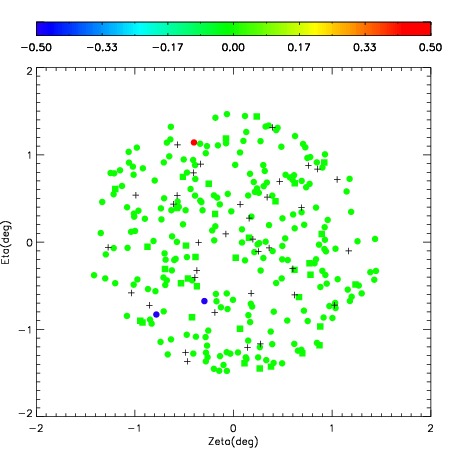
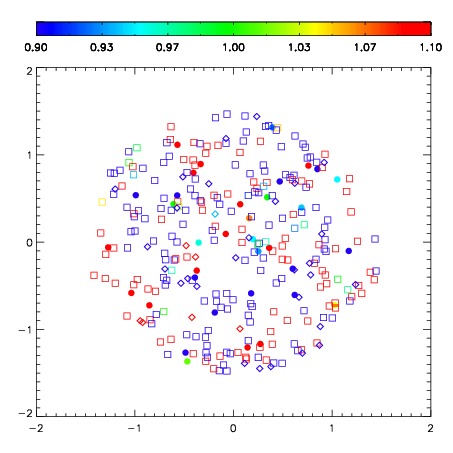
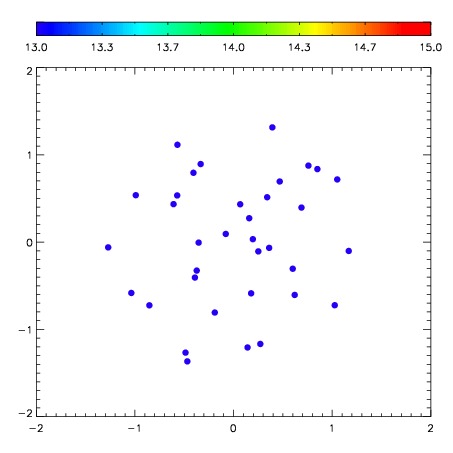
| Frame | Nreads | Zeropoints | Mag plots | Spatial mag deviation | Spatial sky 16325A emission deviations (filled: sky, open: star) | Spatial sky continuum emission | Spatial sky telluric CO2 absorption deviations (filled: H < 10) | |||||||||||||||||||||||
| 0 | 0 |
|
|
|
|
|
|
| IPAIR | NAME | SHIFT | NEWSHIFT | S/N | NAME | SHIFT | NEWSHIFT | S/N |
| 0 | 10240087 | 0.269964 | 0.00000 | 252.680 | 10240088 | -0.0222329 | 0.292197 | 258.639 |
| 1 | 10240083 | 0.258016 | 0.0119480 | 260.380 | 10240085 | -0.0184504 | 0.288414 | 260.920 |
| 2 | 10240082 | 0.258260 | 0.0117040 | 260.119 | 10240084 | -0.0211345 | 0.291099 | 259.876 |
| 3 | 10240086 | 0.268730 | 0.00123399 | 251.657 | 10240081 | 0.00000 | 0.269964 | 255.926 |