| Red | Green | Blue | |
| z | 17.64 | ||
| znorm | Inf | ||
| sky | -Inf | -NaN | -Inf |
| S/N | 21.0 | 35.5 | 40.1 |
| S/N(c) | 0.0 | 0.0 | 0.0 |
| SN(E/C) |

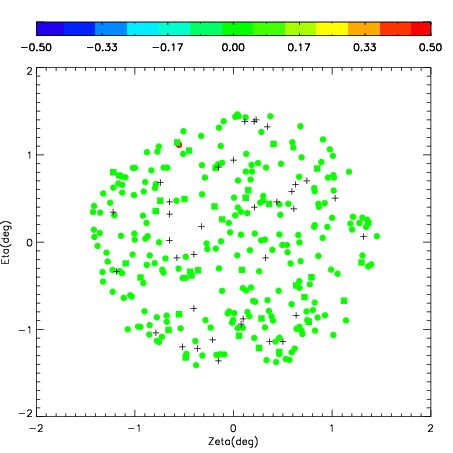

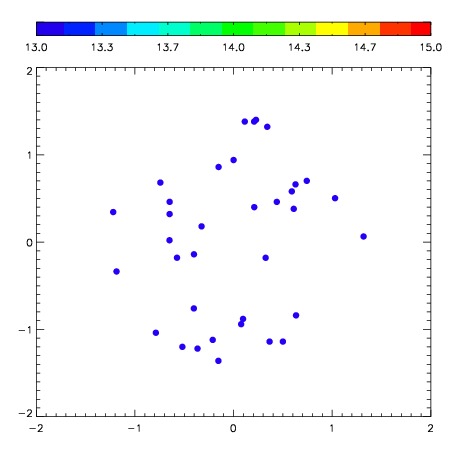
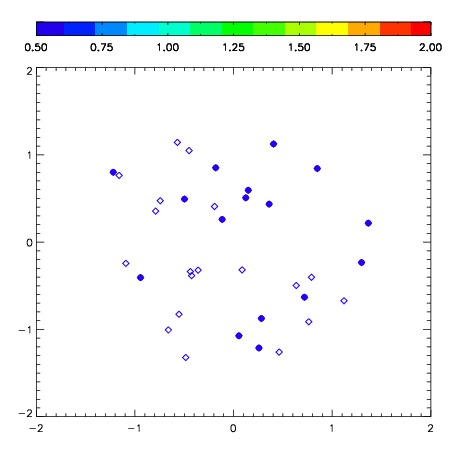
| Frame | Nreads | Zeropoints | Mag plots | Spatial mag deviation | Spatial sky 16325A emission deviations (filled: sky, open: star) | Spatial sky continuum emission | Spatial sky telluric CO2 absorption deviations (filled: H < 10) | |||||||||||||||||||||||
| 0 | 0 |
|
|
|
|
|
|
| IPAIR | NAME | SHIFT | NEWSHIFT | S/N | NAME | SHIFT | NEWSHIFT | S/N |
| 0 | 07230054 | 0.349581 | 0.00000 | 203.911 | 07230055 | 0.00740220 | 0.342179 | 189.706 |
| 1 | 07230053 | 0.329143 | 0.0204380 | 226.742 | 07230048 | 0.00000 | 0.349581 | 210.374 |
| 2 | 07230049 | 0.334777 | 0.0148040 | 221.102 | 07230051 | 0.00553042 | 0.344051 | 208.066 |
| 3 | 07230050 | 0.346881 | 0.00270000 | 208.021 | 07230052 | 0.00730935 | 0.342272 | 206.530 |