| Red | Green | Blue | |
| z | 17.64 | ||
| znorm | Inf | ||
| sky | -NaN | -NaN | -Inf |
| S/N | 19.7 | 35.0 | 38.9 |
| S/N(c) | 0.0 | 0.0 | 0.0 |
| SN(E/C) |
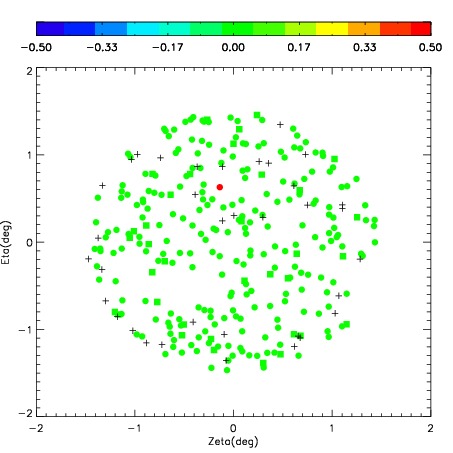
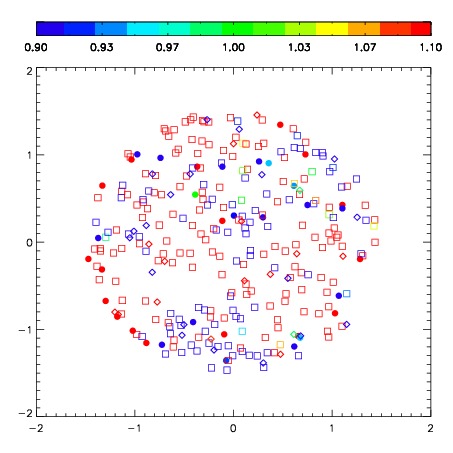


| Frame | Nreads | Zeropoints | Mag plots | Spatial mag deviation | Spatial sky 16325A emission deviations (filled: sky, open: star) | Spatial sky continuum emission | Spatial sky telluric CO2 absorption deviations (filled: H < 10) | |||||||||||||||||||||||
| 0 | 0 |
|
|
|
|
|
|
| IPAIR | NAME | SHIFT | NEWSHIFT | S/N | NAME | SHIFT | NEWSHIFT | S/N |
| 0 | 07510038 | 0.439403 | 0.00000 | 222.913 | 07510036 | 0.00000 | 0.439403 | 238.138 |
| 1 | 07510037 | 0.435720 | 0.00368300 | 216.303 | 07510039 | 0.0154794 | 0.423924 | 218.438 |
| 2 | 07510041 | 0.427730 | 0.0116730 | 213.335 | 07510043 | 0.00657186 | 0.432831 | 216.029 |
| 3 | 07510042 | 0.429504 | 0.00989899 | 212.049 | 07510040 | 0.0112473 | 0.428156 | 210.789 |