| Red | Green | Blue | |
| z | 17.64 | ||
| znorm | Inf | ||
| sky | -Inf | -Inf | -Inf |
| S/N | 14.9 | 27.5 | 29.4 |
| S/N(c) | 0.0 | 0.0 | 0.0 |
| SN(E/C) |

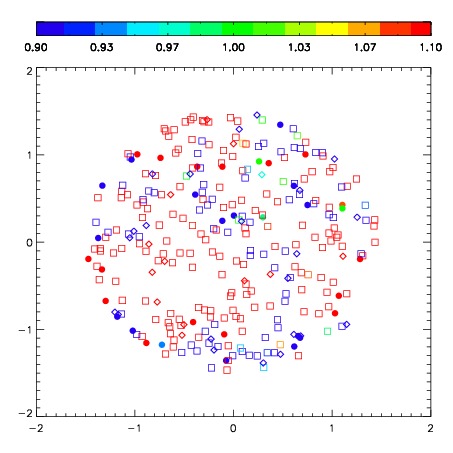


| Frame | Nreads | Zeropoints | Mag plots | Spatial mag deviation | Spatial sky 16325A emission deviations (filled: sky, open: star) | Spatial sky continuum emission | Spatial sky telluric CO2 absorption deviations (filled: H < 10) | |||||||||||||||||||||||
| 0 | 0 |
|
|
|
|
|
|
| IPAIR | NAME | SHIFT | NEWSHIFT | S/N | NAME | SHIFT | NEWSHIFT | S/N |
| 0 | 07880013 | 0.483154 | 0.00000 | 172.905 | 07880011 | 0.00000 | 0.483154 | 162.912 |
| 1 | 07880016 | 0.475672 | 0.00748199 | 222.315 | 07880014 | 0.0220242 | 0.461130 | 232.751 |
| 2 | 07880017 | 0.475758 | 0.00739601 | 217.101 | 07880015 | 0.0253822 | 0.457772 | 231.499 |
| 3 | 07880012 | 0.478324 | 0.00483000 | 204.933 | 07880018 | 0.0302745 | 0.452879 | 220.467 |