| Red | Green | Blue | |
| z | 17.64 | ||
| znorm | Inf | ||
| sky | -NaN | -Inf | -Inf |
| S/N | 17.8 | 32.6 | 37.3 |
| S/N(c) | 0.0 | 0.0 | 0.0 |
| SN(E/C) |
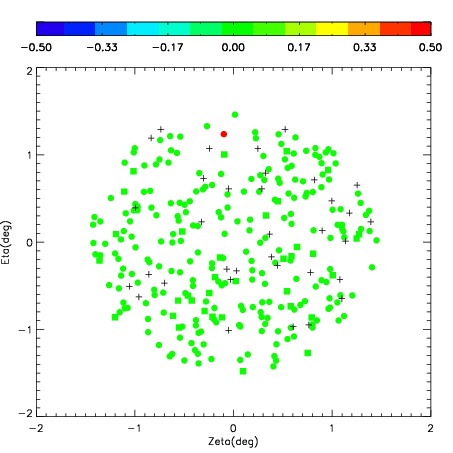
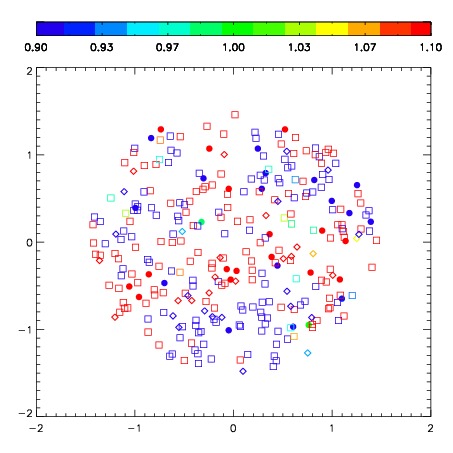


| Frame | Nreads | Zeropoints | Mag plots | Spatial mag deviation | Spatial sky 16325A emission deviations (filled: sky, open: star) | Spatial sky continuum emission | Spatial sky telluric CO2 absorption deviations (filled: H < 10) | |||||||||||||||||||||||
| 0 | 0 |
|
|
|
|
|
|
| IPAIR | NAME | SHIFT | NEWSHIFT | S/N | NAME | SHIFT | NEWSHIFT | S/N |
| 0 | 07220062 | 0.454455 | 0.00000 | 137.420 | 07220061 | 0.0465985 | 0.407856 | 158.159 |
| 1 | 07220059 | 0.425926 | 0.0285290 | 183.530 | 07220057 | 0.00000 | 0.454455 | 187.093 |
| 2 | 07220067 | 0.445266 | 0.00918898 | 173.131 | 07220068 | 0.0424220 | 0.412033 | 173.164 |
| 3 | 07220066 | 0.448225 | 0.00623000 | 165.279 | 07220060 | 0.0502103 | 0.404245 | 172.803 |
| 4 | 07220058 | 0.435786 | 0.0186690 | 155.719 | 07220065 | 0.0463813 | 0.408074 | 164.223 |
| 5 | 07220063 | 0.453807 | 0.000647992 | 131.562 | 07220064 | 0.0480626 | 0.406392 | 138.143 |