| Red | Green | Blue | |
| z | 17.64 | ||
| znorm | Inf | ||
| sky | -Inf | -Inf | -Inf |
| S/N | 22.2 | 37.8 | 43.8 |
| S/N(c) | 0.0 | 0.0 | 0.0 |
| SN(E/C) |

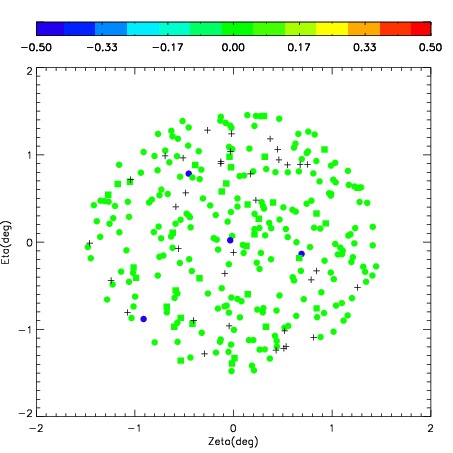
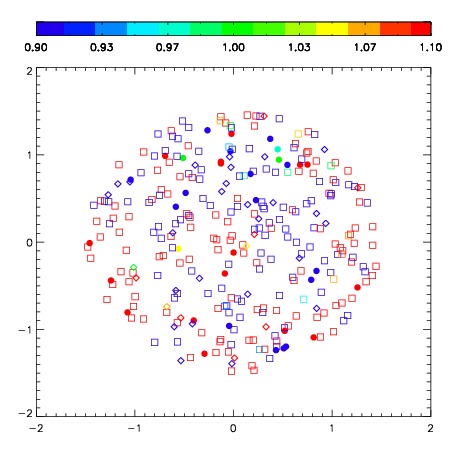


| Frame | Nreads | Zeropoints | Mag plots | Spatial mag deviation | Spatial sky 16325A emission deviations (filled: sky, open: star) | Spatial sky continuum emission | Spatial sky telluric CO2 absorption deviations (filled: H < 10) | |||||||||||||||||||||||
| 0 | 0 |
|
|
|
|
|
|
| IPAIR | NAME | SHIFT | NEWSHIFT | S/N | NAME | SHIFT | NEWSHIFT | S/N |
| 0 | 08450045 | 0.469125 | 0.00000 | 260.764 | 08450044 | 0.00000 | 0.469125 | 279.164 |
| 1 | 08450049 | 0.454647 | 0.0144780 | 308.999 | 08450048 | 0.0286873 | 0.440438 | 306.829 |
| 2 | 08450050 | 0.452980 | 0.0161450 | 308.437 | 08450047 | 0.0306091 | 0.438516 | 297.697 |
| 3 | 08450046 | 0.460840 | 0.00828502 | 297.814 | 08450051 | 0.0323645 | 0.436761 | 297.649 |