| Red | Green | Blue | |
| z | 17.64 | ||
| znorm | Inf | ||
| sky | -Inf | -Inf | -Inf |
| S/N | 20.7 | 35.2 | 38.4 |
| S/N(c) | 0.0 | 0.0 | 0.0 |
| SN(E/C) |

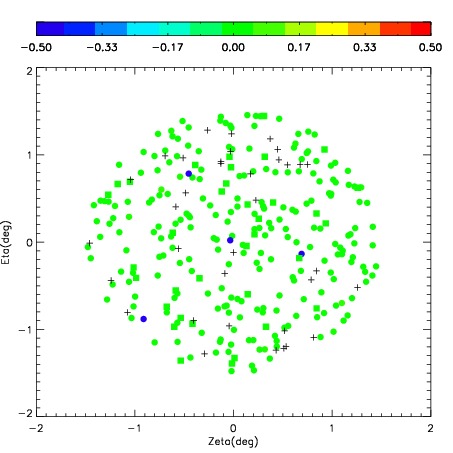
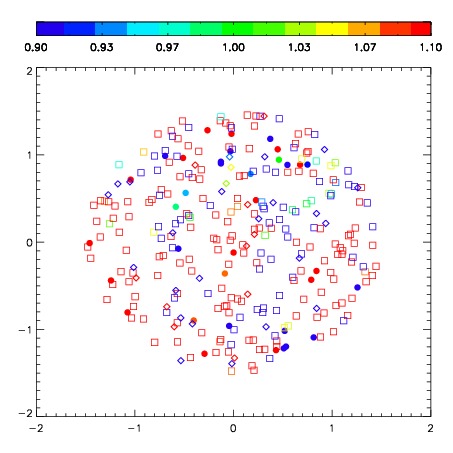


| Frame | Nreads | Zeropoints | Mag plots | Spatial mag deviation | Spatial sky 16325A emission deviations (filled: sky, open: star) | Spatial sky continuum emission | Spatial sky telluric CO2 absorption deviations (filled: H < 10) | |||||||||||||||||||||||
| 0 | 0 |
|
|
|
|
|
|
| IPAIR | NAME | SHIFT | NEWSHIFT | S/N | NAME | SHIFT | NEWSHIFT | S/N |
| 0 | 08730016 | 0.516512 | 0.00000 | 214.947 | 08730015 | 0.0578048 | 0.458707 | 235.955 |
| 1 | 08730017 | 0.499639 | 0.0168730 | 264.302 | 08730018 | 0.0496598 | 0.466852 | 285.731 |
| 2 | 08730012 | 0.478842 | 0.0376700 | 260.699 | 08730011 | 0.00000 | 0.516512 | 266.813 |
| 3 | 08730013 | 0.476405 | 0.0401070 | 259.708 | 08730014 | 0.0541875 | 0.462324 | 239.081 |