| Red | Green | Blue | |
| z | 17.64 | ||
| znorm | Inf | ||
| sky | -Inf | -NaN | -Inf |
| S/N | 6.0 | 11.6 | 12.5 |
| S/N(c) | 0.0 | 0.0 | 0.0 |
| SN(E/C) |

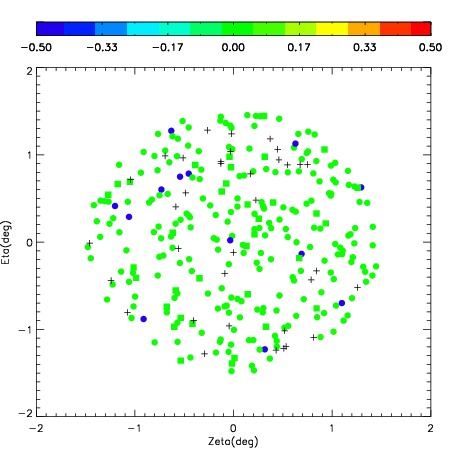
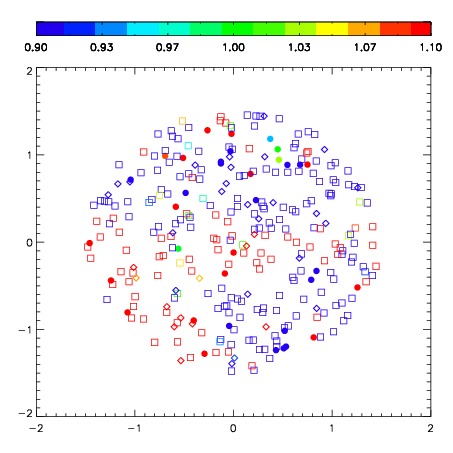


| Frame | Nreads | Zeropoints | Mag plots | Spatial mag deviation | Spatial sky 16325A emission deviations (filled: sky, open: star) | Spatial sky continuum emission | Spatial sky telluric CO2 absorption deviations (filled: H < 10) | |||||||||||||||||||||||
| 0 | 0 |
|
|
|
|
|
|
| IPAIR | NAME | SHIFT | NEWSHIFT | S/N | NAME | SHIFT | NEWSHIFT | S/N |
| 0 | 08780016 | 0.563977 | 0.00000 | 38.2610 | 08780014 | 0.114945 | 0.449032 | 56.0662 |
| 1 | 08780011 | 0.482327 | 0.0816500 | 170.159 | 08780010 | 0.00000 | 0.563977 | 246.310 |
| 2 | 08780012 | 0.537122 | 0.0268550 | 104.749 | 08780013 | 0.0971666 | 0.466810 | 119.720 |