| Red | Green | Blue | |
| z | 17.64 | ||
| znorm | Inf | ||
| sky | -NaN | -Inf | -Inf |
| S/N | 23.1 | 40.1 | 42.5 |
| S/N(c) | 0.0 | 0.0 | 0.0 |
| SN(E/C) |
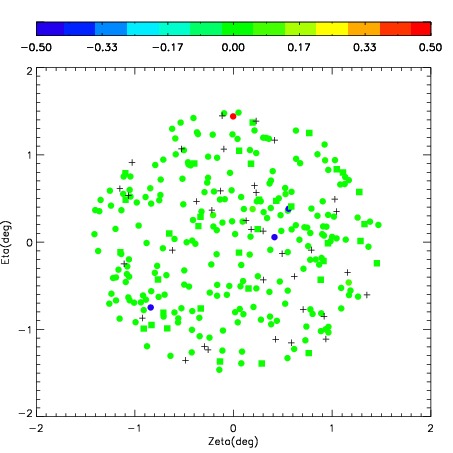

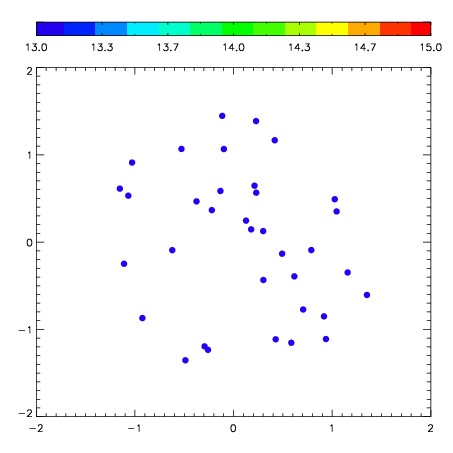
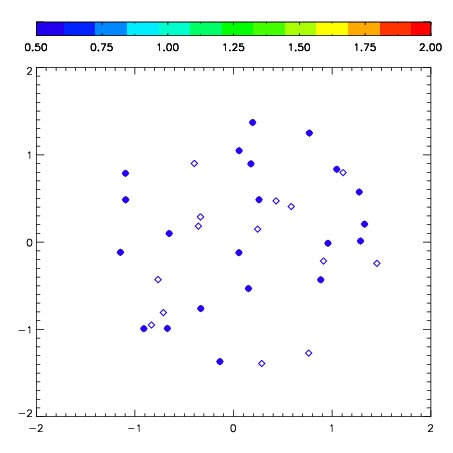
| Frame | Nreads | Zeropoints | Mag plots | Spatial mag deviation | Spatial sky 16325A emission deviations (filled: sky, open: star) | Spatial sky continuum emission | Spatial sky telluric CO2 absorption deviations (filled: H < 10) | |||||||||||||||||||||||
| 0 | 0 |
|
|
|
|
|
|
| IPAIR | NAME | SHIFT | NEWSHIFT | S/N | NAME | SHIFT | NEWSHIFT | S/N |
| 0 | 08450030 | 0.362776 | 0.00000 | 242.226 | 08450032 | -0.0167920 | 0.379568 | 246.206 |
| 1 | 08450034 | 0.354865 | 0.00791100 | 252.624 | 08450036 | -0.0209576 | 0.383734 | 253.569 |
| 2 | 08450031 | 0.356317 | 0.00645900 | 246.233 | 08450033 | -0.0188260 | 0.381602 | 250.164 |
| 3 | 08450035 | 0.356591 | 0.00618502 | 245.822 | 08450029 | 0.00000 | 0.362776 | 246.536 |