| Red | Green | Blue | |
| z | 17.64 | ||
| znorm | Inf | ||
| sky | -Inf | -Inf | -Inf |
| S/N | 25.0 | 42.7 | 48.3 |
| S/N(c) | 0.0 | 0.0 | 0.0 |
| SN(E/C) |


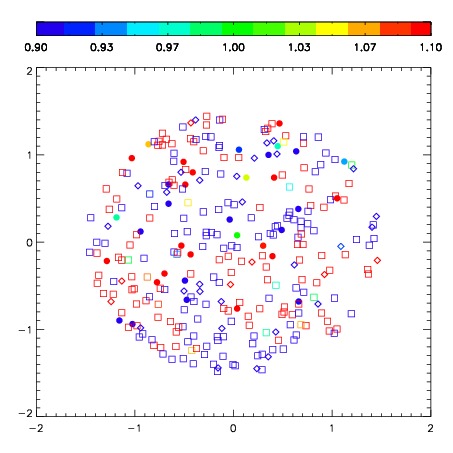


| Frame | Nreads | Zeropoints | Mag plots | Spatial mag deviation | Spatial sky 16325A emission deviations (filled: sky, open: star) | Spatial sky continuum emission | Spatial sky telluric CO2 absorption deviations (filled: H < 10) | |||||||||||||||||||||||
| 0 | 0 |
|
|
|
|
|
|
| IPAIR | NAME | SHIFT | NEWSHIFT | S/N | NAME | SHIFT | NEWSHIFT | S/N |
| 0 | 08410028 | 0.501525 | 0.00000 | 218.044 | 08410030 | 0.0462490 | 0.455276 | 218.441 |
| 1 | 08410032 | 0.490008 | 0.0115170 | 217.947 | 08410029 | 0.0425062 | 0.459019 | 217.387 |
| 2 | 08410031 | 0.485877 | 0.0156480 | 216.304 | 08410026 | 0.00000 | 0.501525 | 215.716 |
| 3 | 08410027 | 0.487808 | 0.0137170 | 213.614 | 08410033 | 0.0475707 | 0.453954 | 212.459 |