| Frame | Nreads | Zeropoints | Mag plots
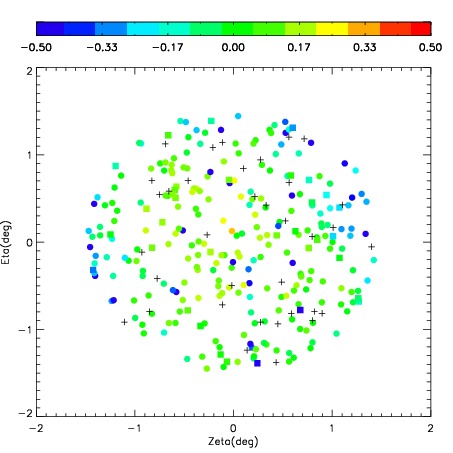
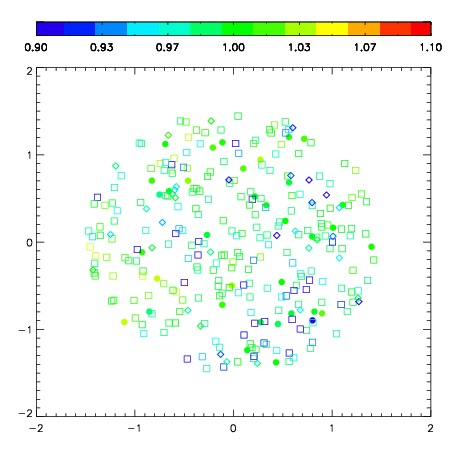
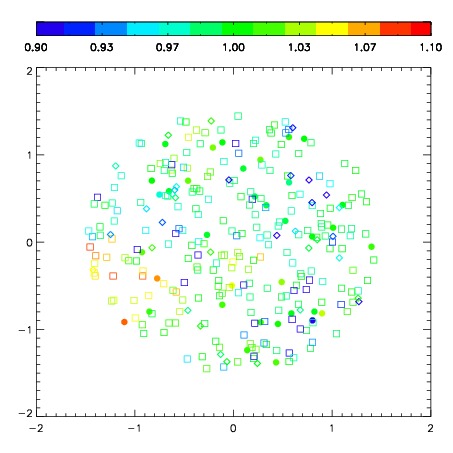
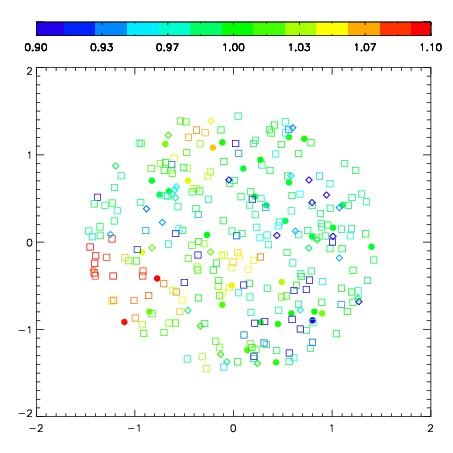
| Spatial mag deviation
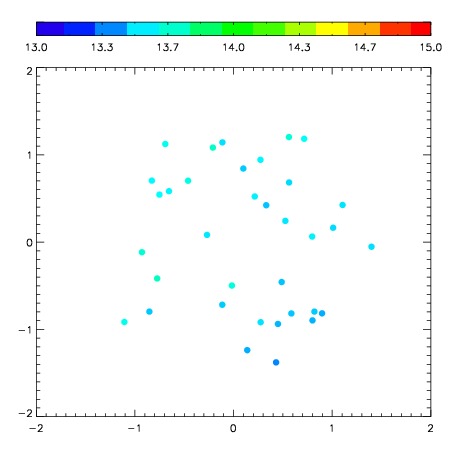
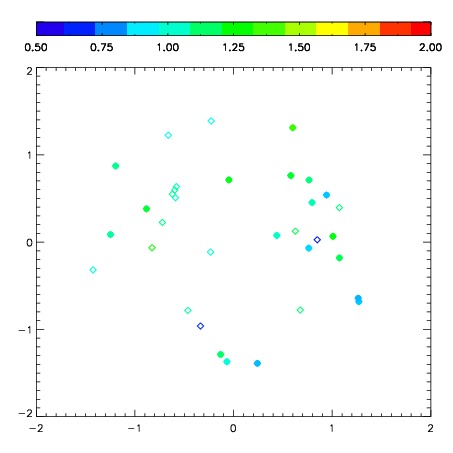
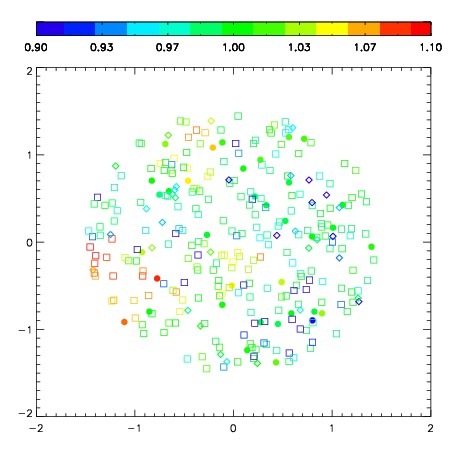
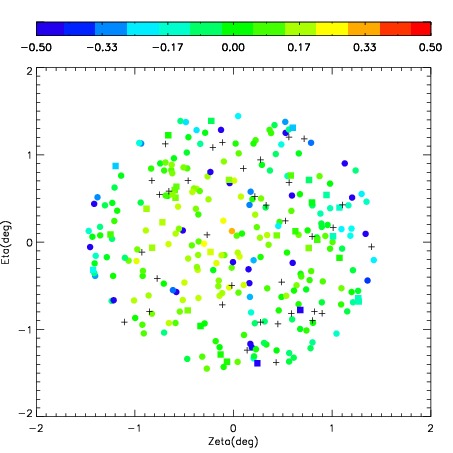
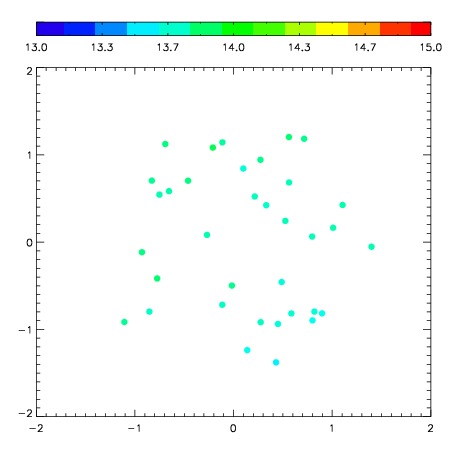
| Spatial sky 16325A emission deviations (filled: sky, open: star)
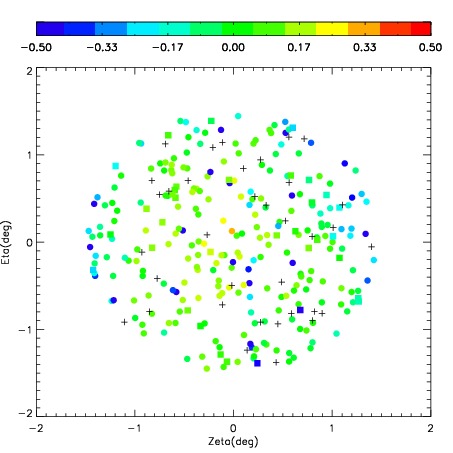
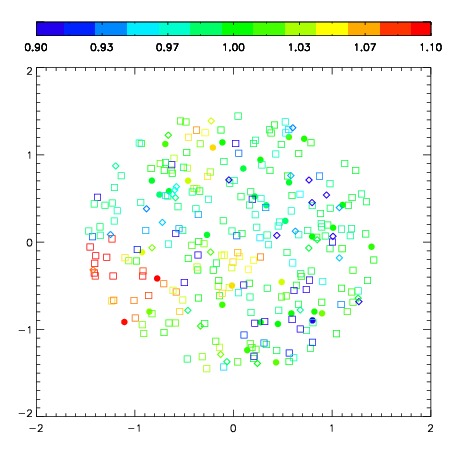
| Spatial sky continuum emission
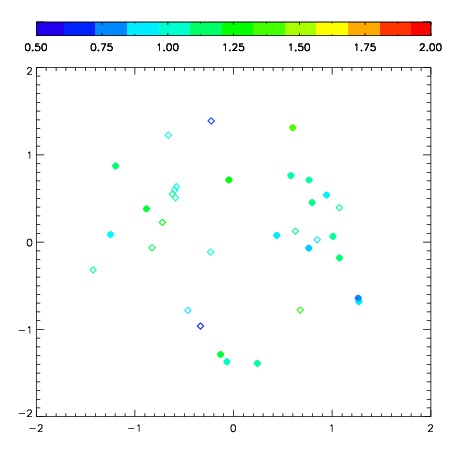
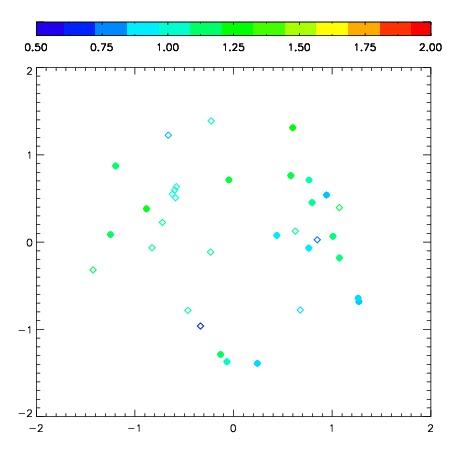
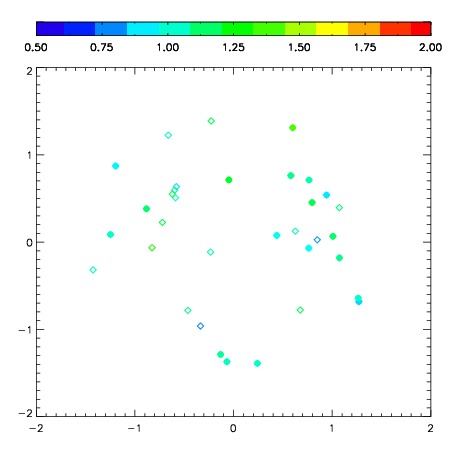
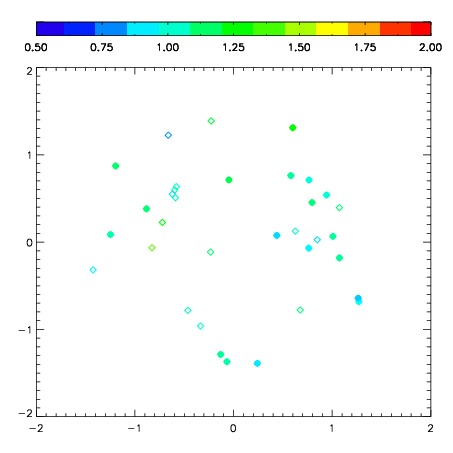
| Spatial sky telluric CO2 absorption deviations (filled: H < 10)
|
| 8440010
| 47
| | Red | Green | Blue
| | z | | 18.77
| | znorm | | 14.59
| | sky | 13.5 | 13.5 | 13.4
| | S/N | 12.3 | 20.3 | 19.9
| | S/N(c) | 11.0 | 18.5 | 18.8
| | SN(E/C) 0.39
|
| 
| 
| 
| 
| 
|
| 8440011
| 47
| | Red | Green | Blue
| | z | | 18.82
| | znorm | | 14.64
| | sky | 13.8 | 13.6 | 13.6
| | S/N | 12.5 | 20.3 | 20.8
| | S/N(c) | 10.9 | 18.6 | 19.6
| | SN(E/C) 0.40
|
| 
| 
| 
| 
| 
|
| 8440012
| 47
| | Red | Green | Blue
| | z | | 18.79
| | znorm | | 14.61
| | sky | 13.6 | 13.6 | 13.6
| | S/N | 11.9 | 19.8 | 20.4
| | S/N(c) | 10.4 | 18.1 | 19.1
| | SN(E/C) 0.38
|
| 
| 
| 
| 
| 
|
| 8440013
| 47
| | Red | Green | Blue
| | z | | 18.79
| | znorm | | 14.61
| | sky | 13.8 | 13.7 | 13.7
| | S/N | 12.0 | 19.9 | 20.7
| | S/N(c) | 10.6 | 18.5 | 19.5
| | SN(E/C) 0.39
|
| 
| 
| 
| 
| 
|
| 8440014
| 47
| | Red | Green | Blue
| | z | | 18.83
| | znorm | | 14.65
| | sky | 13.7 | 13.7 | 13.7
| | S/N | 12.2 | 20.3 | 21.2
| | S/N(c) | 10.9 | 18.7 | 20.1
| | SN(E/C) 0.38
|
| 
| 
| 
| 
| 
|
| 8440015
| 47
| | Red | Green | Blue
| | z | | 18.85
| | znorm | | 14.67
| | sky | 13.7 | 13.7 | 13.6
| | S/N | 12.1 | 20.6 | 21.6
| | S/N(c) | 10.8 | 19.0 | 20.2
| | SN(E/C) 0.37
|
| 
| 
| 
| 
| 
|
| 8440016
| 47
| | Red | Green | Blue
| | z | | 18.84
| | znorm | | 14.66
| | sky | 13.7 | 13.7 | 13.7
| | S/N | 12.4 | 20.9 | 21.8
| | S/N(c) | 11.0 | 19.2 | 20.5
| | SN(E/C) 0.38
|
| 
| 
| 
| 
| 
|
| 8440017
| 47
| | Red | Green | Blue
| | z | | 18.80
| | znorm | | 14.62
| | sky | 13.7 | 13.7 | 13.6
| | S/N | 11.9 | 20.1 | 21.1
| | S/N(c) | 10.5 | 18.6 | 19.8
| | SN(E/C) 0.39
|
| 
| 
| 
| 
| 
|