| Red | Green | Blue | |
| z | 17.64 | ||
| znorm | Inf | ||
| sky | -Inf | -NaN | -NaN |
| S/N | 21.9 | 37.5 | 42.1 |
| S/N(c) | 0.0 | 0.0 | 0.0 |
| SN(E/C) |

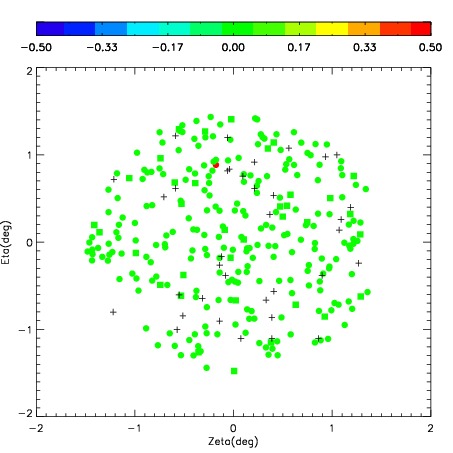


| Frame | Nreads | Zeropoints | Mag plots | Spatial mag deviation | Spatial sky 16325A emission deviations (filled: sky, open: star) | Spatial sky continuum emission | Spatial sky telluric CO2 absorption deviations (filled: H < 10) | |||||||||||||||||||||||
| 0 | 0 |
|
|
|
|
|
|
| IPAIR | NAME | SHIFT | NEWSHIFT | S/N | NAME | SHIFT | NEWSHIFT | S/N |
| 0 | 08480028 | 0.646358 | 0.00000 | 239.289 | 08480030 | 0.144002 | 0.502356 | 245.394 |
| 1 | 08480031 | 0.640651 | 0.00570703 | 241.804 | 08480033 | 0.147614 | 0.498744 | 248.541 |
| 2 | 08480032 | 0.637845 | 0.00851303 | 237.710 | 08480026 | 0.00000 | 0.646358 | 241.836 |
| 3 | 08480027 | 0.640377 | 0.00598103 | 235.865 | 08480029 | 0.145064 | 0.501294 | 237.397 |