| Red | Green | Blue | |
| z | 17.64 | ||
| znorm | Inf | ||
| sky | -Inf | -NaN | -Inf |
| S/N | 21.4 | 35.5 | 38.9 |
| S/N(c) | 0.0 | 0.0 | 0.0 |
| SN(E/C) |

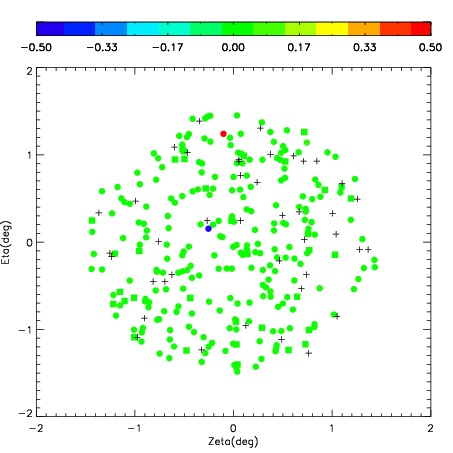
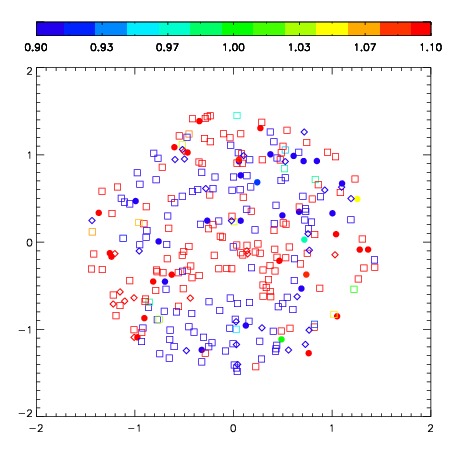


| Frame | Nreads | Zeropoints | Mag plots | Spatial mag deviation | Spatial sky 16325A emission deviations (filled: sky, open: star) | Spatial sky continuum emission | Spatial sky telluric CO2 absorption deviations (filled: H < 10) | |||||||||||||||||||||||
| 0 | 0 |
|
|
|
|
|
|
| IPAIR | NAME | SHIFT | NEWSHIFT | S/N | NAME | SHIFT | NEWSHIFT | S/N |
| 0 | 07620017 | 0.378903 | 0.00000 | 199.984 | 07620018 | 0.0108851 | 0.368018 | 193.834 |
| 1 | 07620012 | 0.363233 | 0.0156700 | 212.816 | 07620011 | 0.00000 | 0.378903 | 212.050 |
| 2 | 07620016 | 0.373494 | 0.00540900 | 203.937 | 07620015 | 0.0124421 | 0.366461 | 200.975 |
| 3 | 07620013 | 0.374270 | 0.00463301 | 178.201 | 07620014 | 0.0149372 | 0.363966 | 187.261 |