| Red | Green | Blue | |
| z | 17.64 | ||
| znorm | Inf | ||
| sky | -NaN | -Inf | -Inf |
| S/N | 23.1 | 36.6 | 44.7 |
| S/N(c) | 0.0 | 0.0 | 0.0 |
| SN(E/C) |

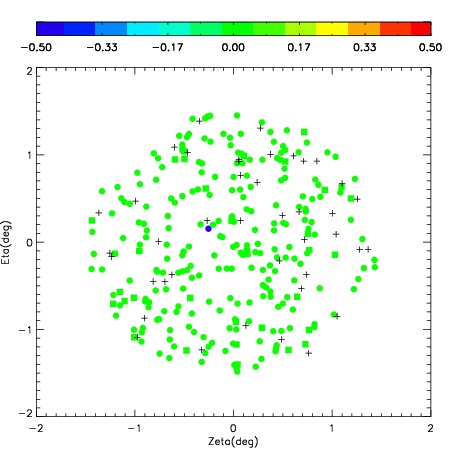
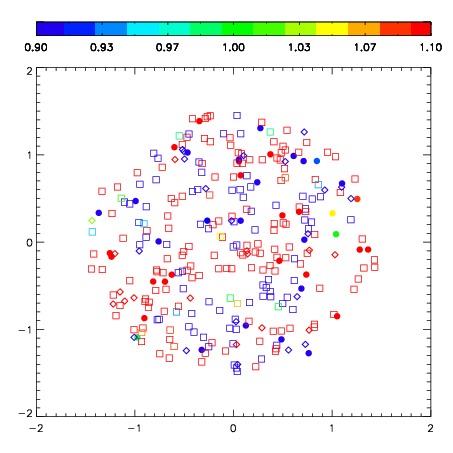


| Frame | Nreads | Zeropoints | Mag plots | Spatial mag deviation | Spatial sky 16325A emission deviations (filled: sky, open: star) | Spatial sky continuum emission | Spatial sky telluric CO2 absorption deviations (filled: H < 10) | |||||||||||||||||||||||
| 0 | 0 |
|
|
|
|
|
|
| IPAIR | NAME | SHIFT | NEWSHIFT | S/N | NAME | SHIFT | NEWSHIFT | S/N |
| 0 | 07900031 | 0.446764 | 0.00000 | 178.668 | 07900033 | 0.0175011 | 0.429263 | 206.590 |
| 1 | 07900028 | 0.440589 | 0.00617498 | 218.183 | 07900030 | 0.0258523 | 0.420912 | 228.415 |
| 2 | 07900027 | 0.435245 | 0.0115190 | 212.065 | 07900026 | 0.00000 | 0.446764 | 224.812 |
| 3 | 07900032 | 0.444970 | 0.00179398 | 179.031 | 07900029 | 0.0200429 | 0.426721 | 222.494 |