| Red | Green | Blue | |
| z | 17.64 | ||
| znorm | Inf | ||
| sky | -Inf | -Inf | -Inf |
| S/N | 22.2 | 37.5 | 44.2 |
| S/N(c) | 0.0 | 0.0 | 0.0 |
| SN(E/C) |

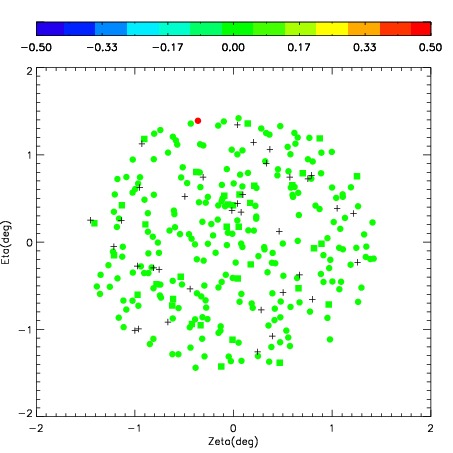
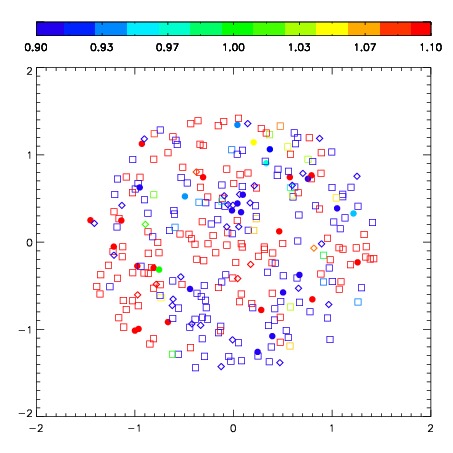


| Frame | Nreads | Zeropoints | Mag plots | Spatial mag deviation | Spatial sky 16325A emission deviations (filled: sky, open: star) | Spatial sky continuum emission | Spatial sky telluric CO2 absorption deviations (filled: H < 10) | |||||||||||||||||||||||
| 0 | 0 |
|
|
|
|
|
|
| IPAIR | NAME | SHIFT | NEWSHIFT | S/N | NAME | SHIFT | NEWSHIFT | S/N |
| 0 | 08460095 | 0.530824 | 0.00000 | 252.030 | 08460094 | 0.00000 | 0.530824 | 244.017 |
| 1 | 08460099 | 0.512854 | 0.0179700 | 260.772 | 08460097 | 0.0891214 | 0.441703 | 260.296 |
| 2 | 08460096 | 0.525905 | 0.00491899 | 257.346 | 08460098 | 0.0851089 | 0.445715 | 255.380 |
| 3 | 08460100 | 0.519348 | 0.0114760 | 251.278 | 08460101 | 0.0874758 | 0.443348 | 227.066 |