| Red | Green | Blue | |
| z | 17.64 | ||
| znorm | Inf | ||
| sky | -Inf | -NaN | -Inf |
| S/N | 26.7 | 47.5 | 51.2 |
| S/N(c) | 0.0 | 0.0 | 0.0 |
| SN(E/C) |

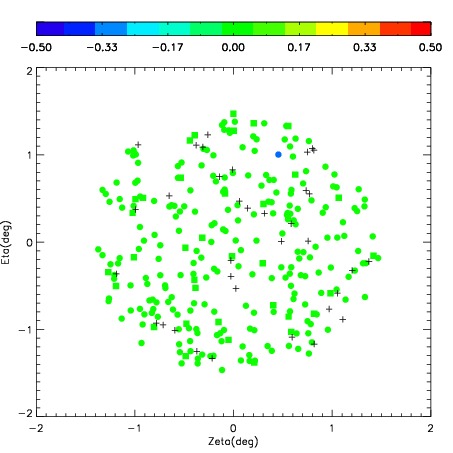
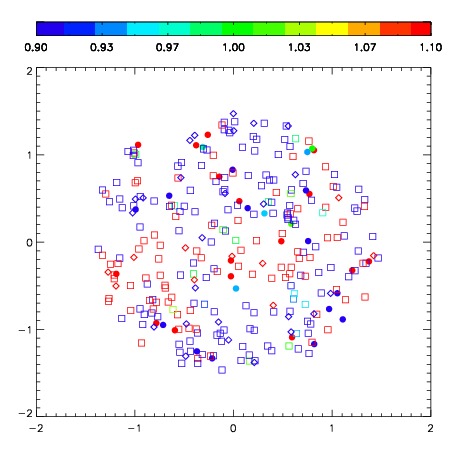

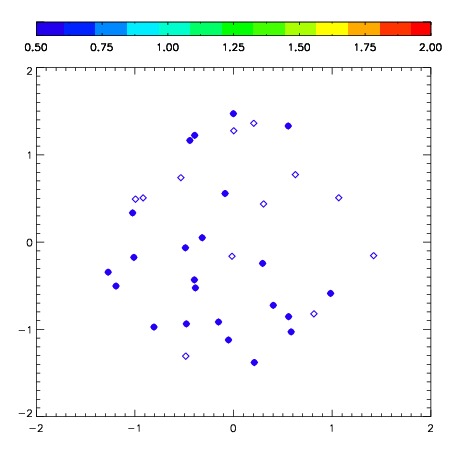
| Frame | Nreads | Zeropoints | Mag plots | Spatial mag deviation | Spatial sky 16325A emission deviations (filled: sky, open: star) | Spatial sky continuum emission | Spatial sky telluric CO2 absorption deviations (filled: H < 10) | |||||||||||||||||||||||
| 0 | 0 |
|
|
|
|
|
|
| IPAIR | NAME | SHIFT | NEWSHIFT | S/N | NAME | SHIFT | NEWSHIFT | S/N |
| 0 | 08490013 | 0.445777 | 0.00000 | 268.065 | 08490014 | 0.0220272 | 0.423750 | 272.351 |
| 1 | 08490017 | 0.432423 | 0.0133540 | 276.701 | 08490018 | 0.0237136 | 0.422063 | 278.258 |
| 2 | 08490016 | 0.431719 | 0.0140580 | 275.239 | 08490015 | 0.0243468 | 0.421430 | 274.259 |
| 3 | 08490012 | 0.443213 | 0.00256401 | 232.406 | 08490011 | 0.00000 | 0.445777 | 265.250 |