| Red | Green | Blue | |
| z | 17.64 | ||
| znorm | Inf | ||
| sky | -NaN | -NaN | -Inf |
| S/N | 22.6 | 41.9 | 44.1 |
| S/N(c) | 0.0 | 0.0 | 0.0 |
| SN(E/C) |

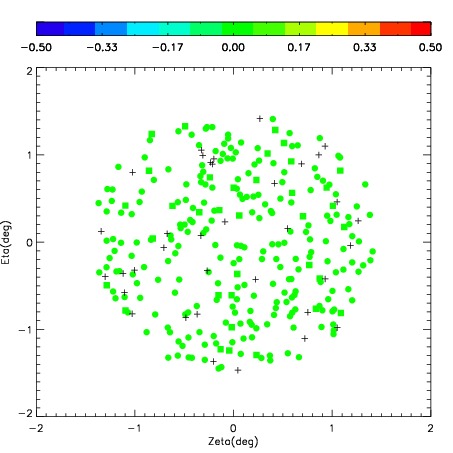
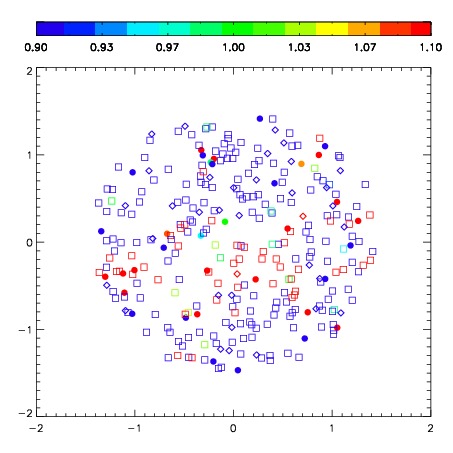
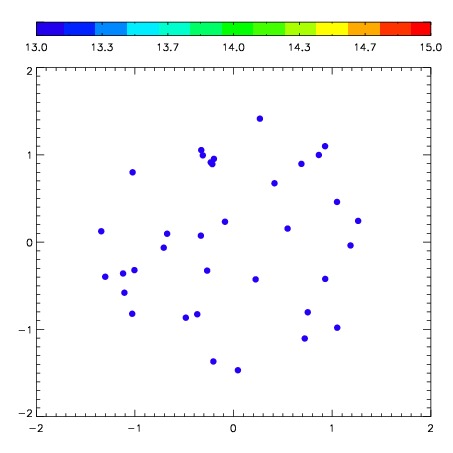

| Frame | Nreads | Zeropoints | Mag plots | Spatial mag deviation | Spatial sky 16325A emission deviations (filled: sky, open: star) | Spatial sky continuum emission | Spatial sky telluric CO2 absorption deviations (filled: H < 10) | |||||||||||||||||||||||
| 0 | 0 |
|
|
|
|
|
|
| IPAIR | NAME | SHIFT | NEWSHIFT | S/N | NAME | SHIFT | NEWSHIFT | S/N |
| 0 | 08510030 | 0.407228 | 0.00000 | 248.020 | 08510033 | 0.0152840 | 0.391944 | 250.693 |
| 1 | 08510035 | 0.376617 | 0.0306110 | 257.183 | 08510036 | 0.0123797 | 0.394848 | 257.722 |
| 2 | 08510031 | 0.391138 | 0.0160900 | 247.798 | 08510032 | 0.0149276 | 0.392300 | 250.060 |
| 3 | 08510034 | 0.391621 | 0.0156070 | 246.150 | 08510029 | 0.00000 | 0.407228 | 244.217 |