| Red | Green | Blue | |
| z | 17.64 | ||
| znorm | Inf | ||
| sky | -NaN | -NaN | -Inf |
| S/N | 21.9 | 38.7 | 41.8 |
| S/N(c) | 0.0 | 0.0 | 0.0 |
| SN(E/C) |


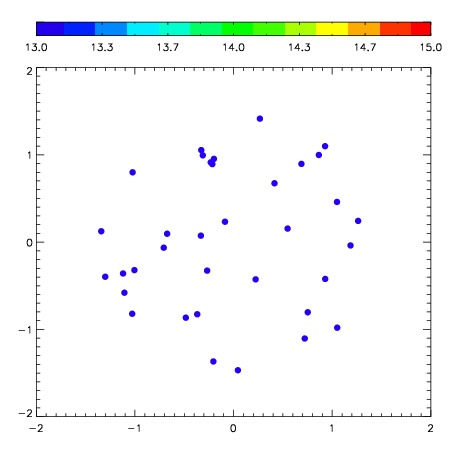
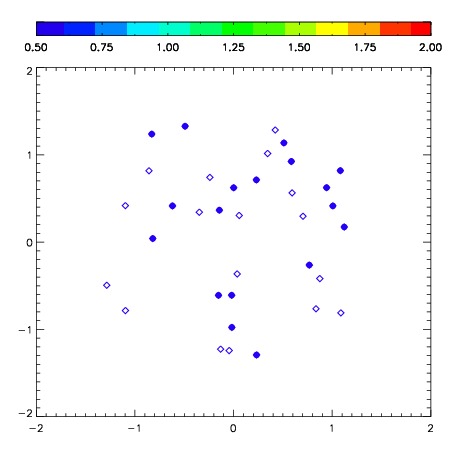
| Frame | Nreads | Zeropoints | Mag plots | Spatial mag deviation | Spatial sky 16325A emission deviations (filled: sky, open: star) | Spatial sky continuum emission | Spatial sky telluric CO2 absorption deviations (filled: H < 10) | |||||||||||||||||||||||
| 0 | 0 |
|
|
|
|
|
|
| IPAIR | NAME | SHIFT | NEWSHIFT | S/N | NAME | SHIFT | NEWSHIFT | S/N |
| 0 | 08700050 | 0.322193 | 0.00000 | 241.356 | 08700055 | 0.00691894 | 0.315274 | 242.442 |
| 1 | 08700057 | 0.296213 | 0.0259800 | 253.015 | 08700056 | 0.00350132 | 0.318692 | 249.773 |
| 2 | 08700054 | 0.301387 | 0.0208060 | 244.076 | 08700051 | 0.00595276 | 0.316240 | 243.725 |
| 3 | 08700053 | 0.303385 | 0.0188080 | 243.210 | 08700052 | 0.00596923 | 0.316224 | 243.591 |
| 4 | 08700049 | 0.319846 | 0.00234699 | 232.845 | 08700048 | 0.00000 | 0.322193 | 234.841 |