| Red | Green | Blue | |
| z | 17.64 | ||
| znorm | Inf | ||
| sky | -Inf | -Inf | -Inf |
| S/N | 23.7 | 41.4 | 46.4 |
| S/N(c) | 0.0 | 0.0 | 0.0 |
| SN(E/C) |

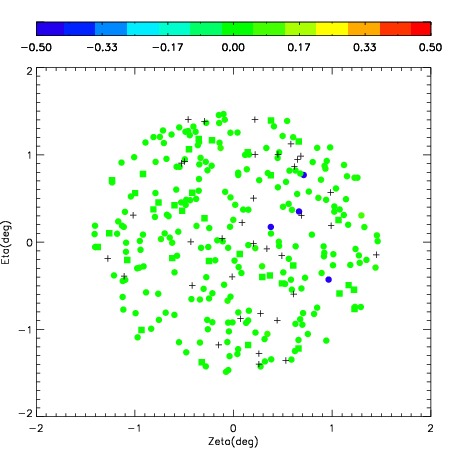
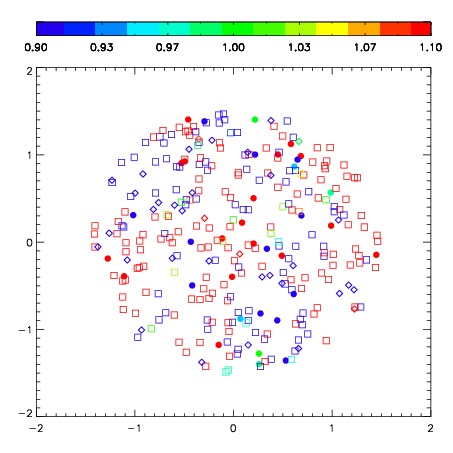


| Frame | Nreads | Zeropoints | Mag plots | Spatial mag deviation | Spatial sky 16325A emission deviations (filled: sky, open: star) | Spatial sky continuum emission | Spatial sky telluric CO2 absorption deviations (filled: H < 10) | |||||||||||||||||||||||
| 0 | 0 |
|
|
|
|
|
|
| IPAIR | NAME | SHIFT | NEWSHIFT | S/N | NAME | SHIFT | NEWSHIFT | S/N |
| 0 | 08500045 | 0.461310 | 0.00000 | 234.306 | 08500044 | 0.00000 | 0.461310 | 228.346 |
| 1 | 08500046 | 0.460284 | 0.00102600 | 230.642 | 08500048 | 0.0283140 | 0.432996 | 226.814 |
| 2 | 08500050 | 0.444585 | 0.0167250 | 226.243 | 08500051 | 0.0319751 | 0.429335 | 224.725 |
| 3 | 08500049 | 0.455365 | 0.00594500 | 223.814 | 08500047 | 0.0305391 | 0.430771 | 219.270 |