| Red | Green | Blue | |
| z | 17.64 | ||
| znorm | Inf | ||
| sky | -Inf | -Inf | -Inf |
| S/N | 26.1 | 45.0 | 49.4 |
| S/N(c) | 0.0 | 0.0 | 0.0 |
| SN(E/C) |

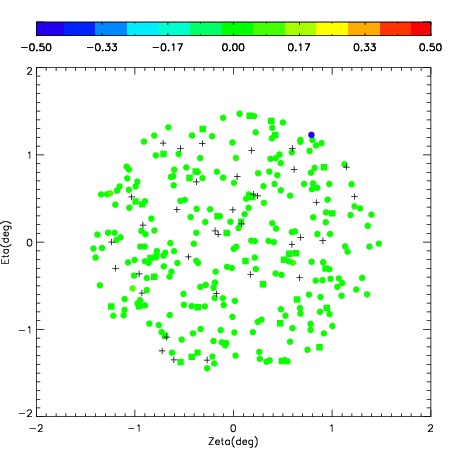
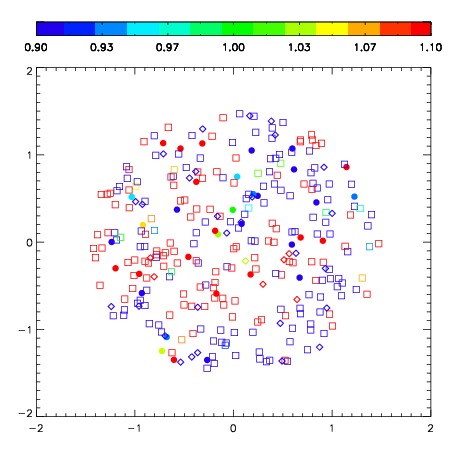
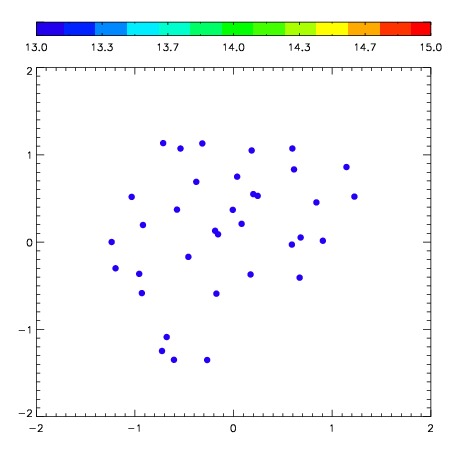
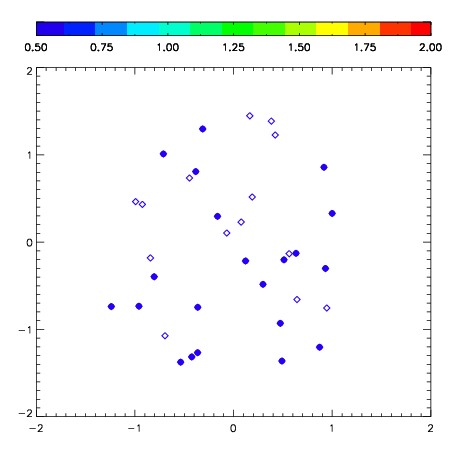
| Frame | Nreads | Zeropoints | Mag plots | Spatial mag deviation | Spatial sky 16325A emission deviations (filled: sky, open: star) | Spatial sky continuum emission | Spatial sky telluric CO2 absorption deviations (filled: H < 10) | |||||||||||||||||||||||
| 0 | 0 |
|
|
|
|
|
|
| IPAIR | NAME | SHIFT | NEWSHIFT | S/N | NAME | SHIFT | NEWSHIFT | S/N |
| 0 | 08490027 | 0.544961 | 0.00000 | 234.075 | 08490029 | 0.0787786 | 0.466182 | 232.372 |
| 1 | 08490032 | 0.535942 | 0.00901896 | 236.363 | 08490026 | 0.00000 | 0.544961 | 239.628 |
| 2 | 08490028 | 0.537143 | 0.00781798 | 235.996 | 08490033 | 0.0839399 | 0.461021 | 233.818 |
| 3 | 08490031 | 0.535239 | 0.00972199 | 230.117 | 08490030 | 0.0796571 | 0.465304 | 231.597 |