| Red | Green | Blue | |
| z | 17.64 | ||
| znorm | Inf | ||
| sky | -Inf | -Inf | -Inf |
| S/N | 22.9 | 41.5 | 45.8 |
| S/N(c) | 0.0 | 0.0 | 0.0 |
| SN(E/C) |

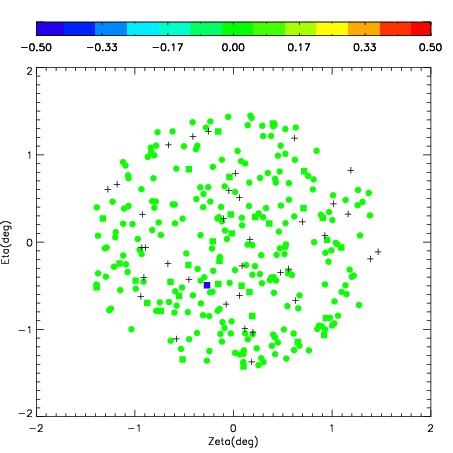

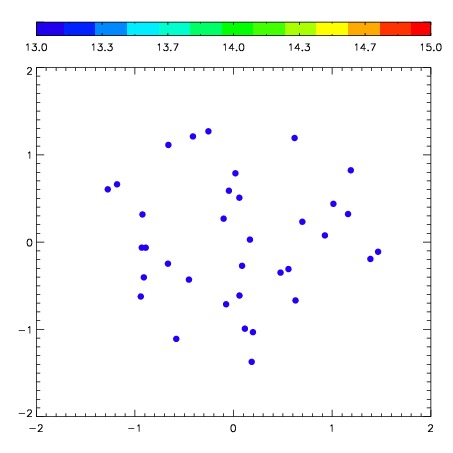
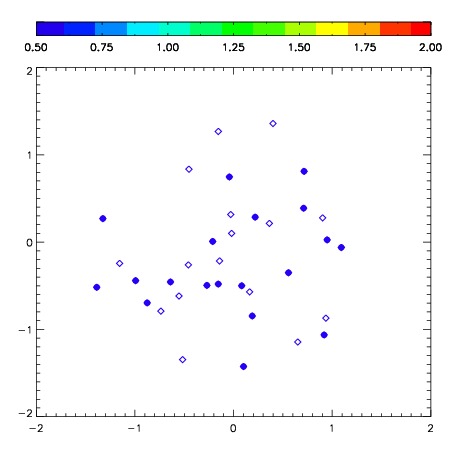
| Frame | Nreads | Zeropoints | Mag plots | Spatial mag deviation | Spatial sky 16325A emission deviations (filled: sky, open: star) | Spatial sky continuum emission | Spatial sky telluric CO2 absorption deviations (filled: H < 10) | |||||||||||||||||||||||
| 0 | 0 |
|
|
|
|
|
|
| IPAIR | NAME | SHIFT | NEWSHIFT | S/N | NAME | SHIFT | NEWSHIFT | S/N |
| 0 | 08480058 | 0.452759 | 0.00000 | 274.808 | 08480057 | 0.00000 | 0.452759 | 266.593 |
| 1 | 08480059 | 0.451136 | 0.00162300 | 283.280 | 08480060 | 0.0197014 | 0.433058 | 287.988 |
| 2 | 08480062 | 0.445750 | 0.00700900 | 281.327 | 08480061 | 0.0210221 | 0.431737 | 285.548 |
| 3 | 08480063 | 0.446001 | 0.00675800 | 277.974 | 08480064 | 0.0202146 | 0.432544 | 282.096 |