| Red | Green | Blue | |
| z | 17.64 | ||
| znorm | Inf | ||
| sky | -Inf | -Inf | -Inf |
| S/N | 25.2 | 44.7 | 49.1 |
| S/N(c) | 0.0 | 0.0 | 0.0 |
| SN(E/C) |
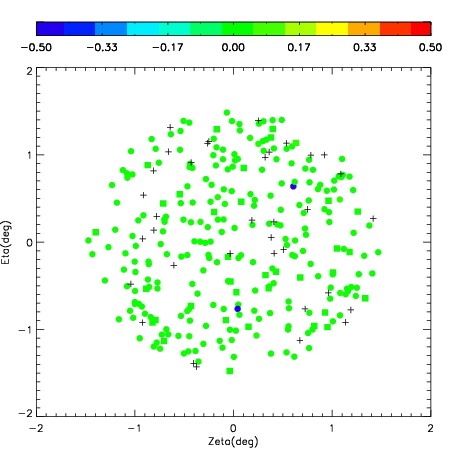
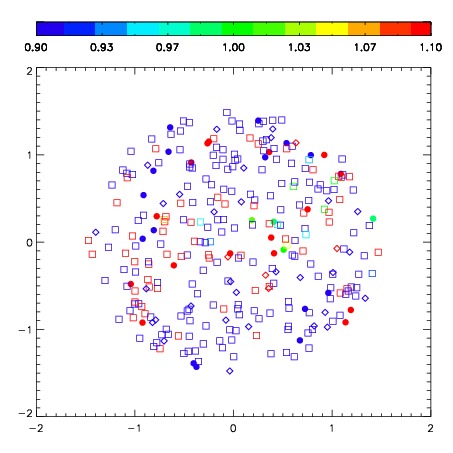


| Frame | Nreads | Zeropoints | Mag plots | Spatial mag deviation | Spatial sky 16325A emission deviations (filled: sky, open: star) | Spatial sky continuum emission | Spatial sky telluric CO2 absorption deviations (filled: H < 10) | |||||||||||||||||||||||
| 0 | 0 |
|
|
|
|
|
|
| IPAIR | NAME | SHIFT | NEWSHIFT | S/N | NAME | SHIFT | NEWSHIFT | S/N |
| 0 | 08160042 | 0.367591 | 0.00000 | 275.859 | 08160039 | -0.0175717 | 0.385163 | 277.919 |
| 1 | 08160041 | 0.359646 | 0.00794500 | 276.362 | 08160040 | -0.0171257 | 0.384717 | 278.102 |
| 2 | 08160038 | 0.359497 | 0.00809398 | 275.544 | 08160043 | -0.0201111 | 0.387702 | 276.895 |
| 3 | 08160037 | 0.360328 | 0.00726300 | 274.551 | 08160036 | 0.00000 | 0.367591 | 268.536 |