| Red | Green | Blue | |
| z | 17.64 | ||
| znorm | Inf | ||
| sky | -Inf | -Inf | -Inf |
| S/N | 18.3 | 33.0 | 37.9 |
| S/N(c) | 0.0 | 0.0 | 0.0 |
| SN(E/C) |


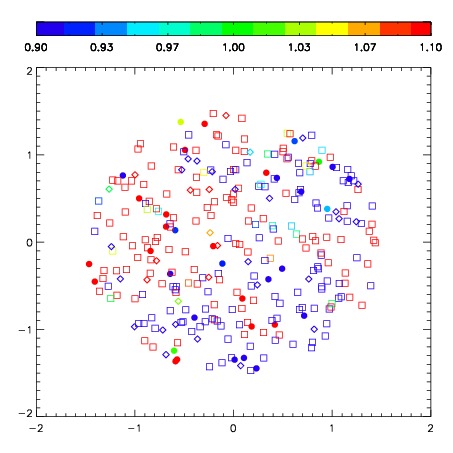
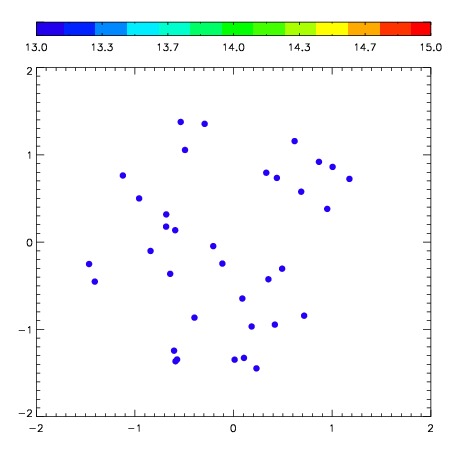
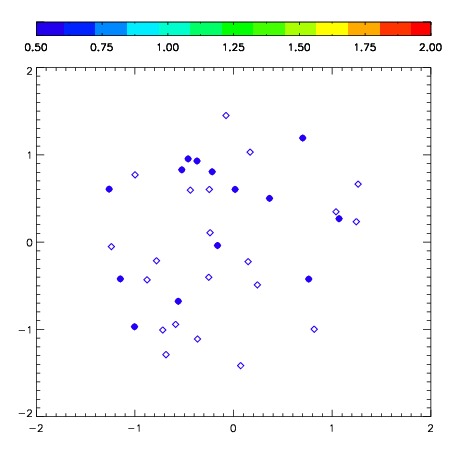
| Frame | Nreads | Zeropoints | Mag plots | Spatial mag deviation | Spatial sky 16325A emission deviations (filled: sky, open: star) | Spatial sky continuum emission | Spatial sky telluric CO2 absorption deviations (filled: H < 10) | |||||||||||||||||||||||
| 0 | 0 |
|
|
|
|
|
|
| IPAIR | NAME | SHIFT | NEWSHIFT | S/N | NAME | SHIFT | NEWSHIFT | S/N |
| 0 | 07830073 | 0.376103 | 0.00000 | 178.123 | 07830074 | -0.0274893 | 0.403592 | 183.756 |
| 1 | 07830072 | 0.357680 | 0.0184230 | 205.879 | 07830071 | 0.00000 | 0.376103 | 211.339 |
| 2 | 07830077 | 0.365831 | 0.0102720 | 202.419 | 07830078 | -0.0218309 | 0.397934 | 206.767 |
| 3 | 07830076 | 0.358439 | 0.0176640 | 198.303 | 07830075 | -0.0218111 | 0.397914 | 196.585 |