| Red | Green | Blue | |
| z | 17.64 | ||
| znorm | Inf | ||
| sky | -Inf | -Inf | -Inf |
| S/N | 23.2 | 41.1 | 44.3 |
| S/N(c) | 0.0 | 0.0 | 0.0 |
| SN(E/C) |

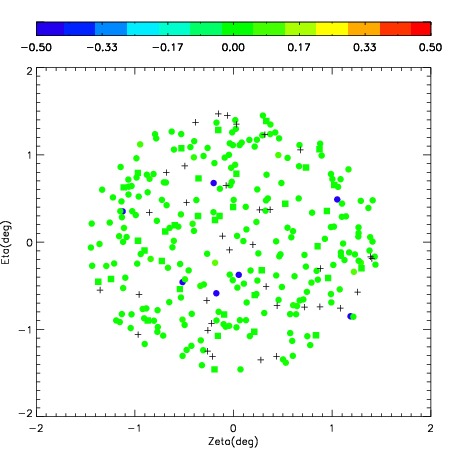
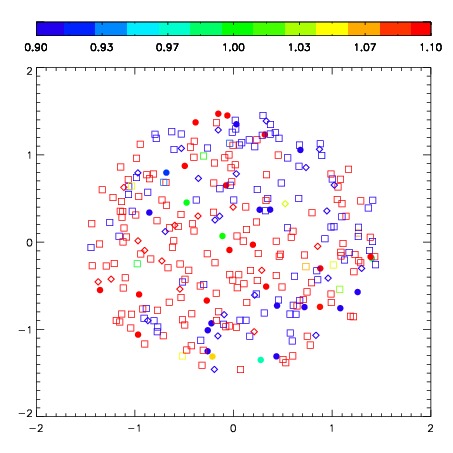
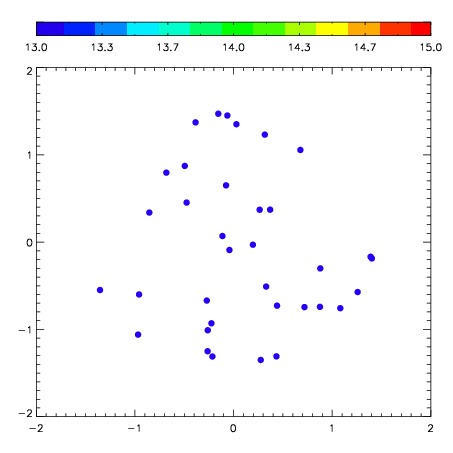
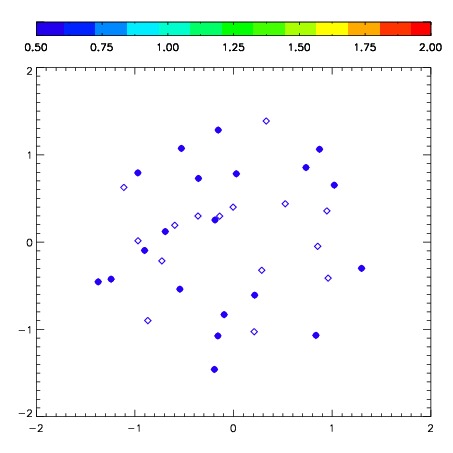
| Frame | Nreads | Zeropoints | Mag plots | Spatial mag deviation | Spatial sky 16325A emission deviations (filled: sky, open: star) | Spatial sky continuum emission | Spatial sky telluric CO2 absorption deviations (filled: H < 10) | |||||||||||||||||||||||
| 0 | 0 |
|
|
|
|
|
|
| IPAIR | NAME | SHIFT | NEWSHIFT | S/N | NAME | SHIFT | NEWSHIFT | S/N |
| 0 | 08210027 | 0.385994 | 0.00000 | 257.498 | 08210026 | -0.0530461 | 0.439040 | 224.312 |
| 1 | 08210028 | 0.385163 | 0.000830978 | 270.003 | 08210022 | 0.00000 | 0.385994 | 268.276 |
| 2 | 08210023 | 0.373562 | 0.0124320 | 269.313 | 08210029 | -0.0542370 | 0.440231 | 265.596 |
| 3 | 08210024 | 0.382281 | 0.00371298 | 257.917 | 08210025 | -0.0537540 | 0.439748 | 248.408 |