| Red | Green | Blue | |
| z | 17.64 | ||
| znorm | Inf | ||
| sky | -NaN | -Inf | -Inf |
| S/N | 21.3 | 38.4 | 43.3 |
| S/N(c) | 0.0 | 0.0 | 0.0 |
| SN(E/C) |
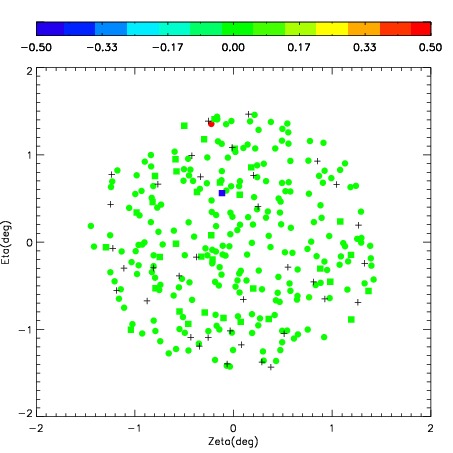
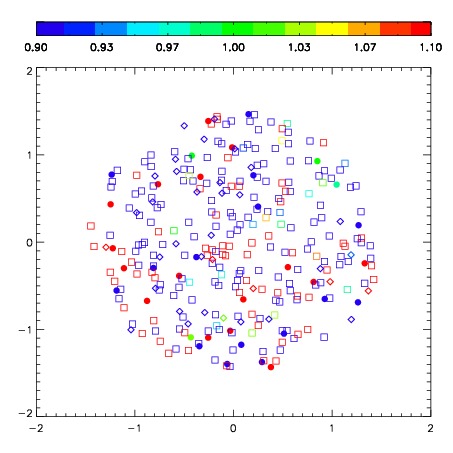
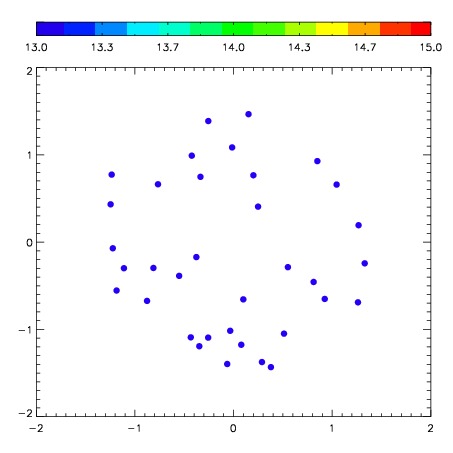
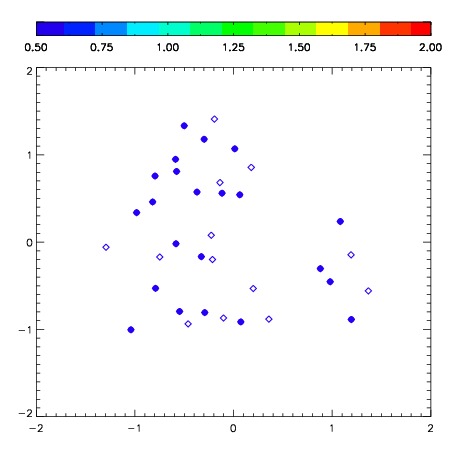
| Frame | Nreads | Zeropoints | Mag plots | Spatial mag deviation | Spatial sky 16325A emission deviations (filled: sky, open: star) | Spatial sky continuum emission | Spatial sky telluric CO2 absorption deviations (filled: H < 10) | |||||||||||||||||||||||
| 0 | 0 |
|
|
|
|
|
|
| IPAIR | NAME | SHIFT | NEWSHIFT | S/N | NAME | SHIFT | NEWSHIFT | S/N |
| 0 | 08160053 | 0.361480 | 0.00000 | 270.493 | 08160054 | -0.0209719 | 0.382452 | 269.041 |
| 1 | 08160049 | 0.358750 | 0.00273001 | 254.735 | 08160050 | -0.0248057 | 0.386286 | 253.154 |
| 2 | 08160048 | 0.351216 | 0.0102640 | 254.331 | 08160051 | -0.0233637 | 0.384844 | 251.546 |
| 3 | 08160052 | 0.355945 | 0.00553501 | 245.991 | 08160047 | 0.00000 | 0.361480 | 248.600 |