| Red | Green | Blue | |
| z | 17.64 | ||
| znorm | Inf | ||
| sky | -Inf | -Inf | -Inf |
| S/N | 10.7 | 20.6 | 23.0 |
| S/N(c) | 0.0 | 0.0 | 0.0 |
| SN(E/C) |
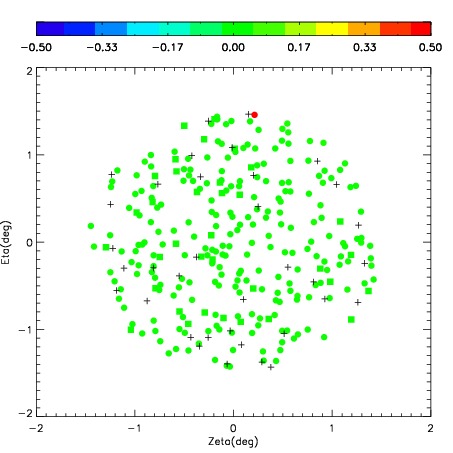
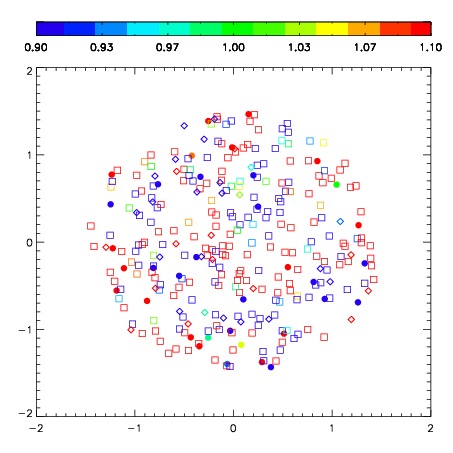

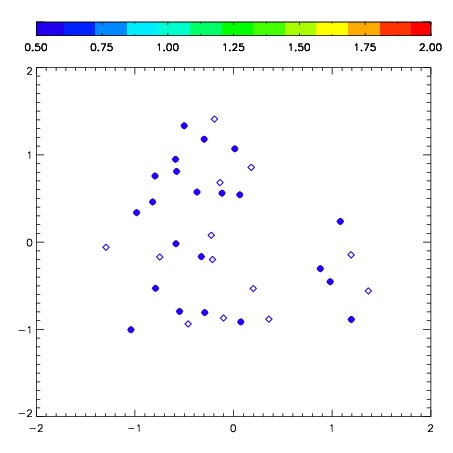
| Frame | Nreads | Zeropoints | Mag plots | Spatial mag deviation | Spatial sky 16325A emission deviations (filled: sky, open: star) | Spatial sky continuum emission | Spatial sky telluric CO2 absorption deviations (filled: H < 10) | |||||||||||||||||||||||
| 0 | 0 |
|
|
|
|
|
|
| IPAIR | NAME | SHIFT | NEWSHIFT | S/N | NAME | SHIFT | NEWSHIFT | S/N |
| 0 | 08220038 | 1.98728 | 0.00000 | 124.348 | 08220037 | 1.43699 | 0.550290 | 172.861 |
| 1 | 08220040 | 1.43012 | 0.557160 | 220.873 | 08220033 | 0.00000 | 1.98728 | 191.872 |
| 2 | 08220039 | 1.97302 | 0.0142601 | 163.814 | 08220034 | 0.439709 | 1.54757 | 189.961 |