| Red | Green | Blue | |
| z | 17.64 | ||
| znorm | Inf | ||
| sky | -Inf | -Inf | -Inf |
| S/N | 19.5 | 33.9 | 38.1 |
| S/N(c) | 0.0 | 0.0 | 0.0 |
| SN(E/C) |

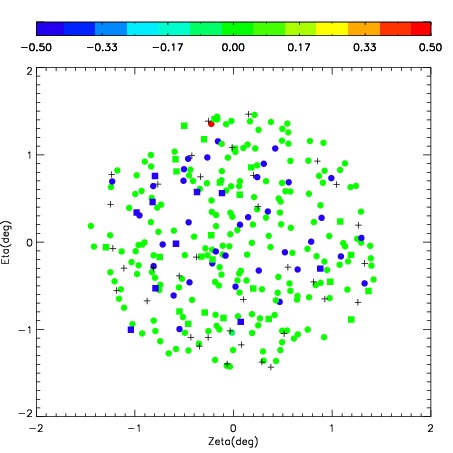
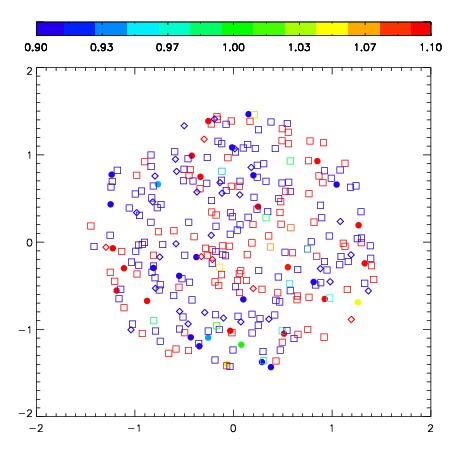
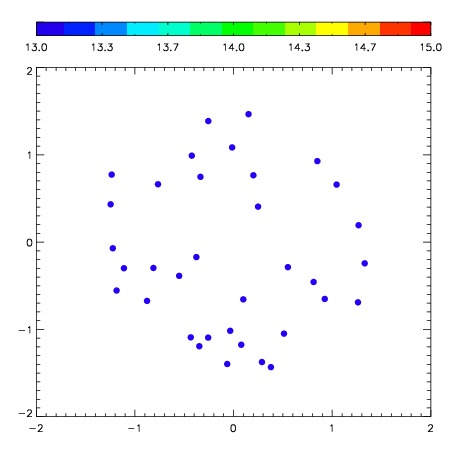
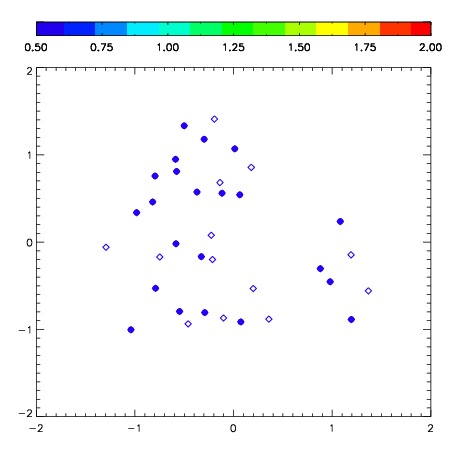
| Frame | Nreads | Zeropoints | Mag plots | Spatial mag deviation | Spatial sky 16325A emission deviations (filled: sky, open: star) | Spatial sky continuum emission | Spatial sky telluric CO2 absorption deviations (filled: H < 10) | |||||||||||||||||||||||
| 0 | 0 |
|
|
|
|
|
|
| IPAIR | NAME | SHIFT | NEWSHIFT | S/N | NAME | SHIFT | NEWSHIFT | S/N |
| 0 | 09070031 | 0.409937 | 0.00000 | 271.215 | 09070029 | 0.00489716 | 0.405040 | 280.272 |
| 1 | 09070030 | 0.408785 | 0.00115201 | 271.201 | 09070028 | 0.00510876 | 0.404828 | 276.545 |
| 2 | 09070027 | 0.277978 | 0.131959 | 0.00000 | 09070025 | 0.00000 | 0.409937 | 274.125 |