| Red | Green | Blue | |
| z | 17.64 | ||
| znorm | Inf | ||
| sky | -NaN | -NaN | -Inf |
| S/N | 19.7 | 35.4 | 40.8 |
| S/N(c) | 0.0 | 0.0 | 0.0 |
| SN(E/C) |

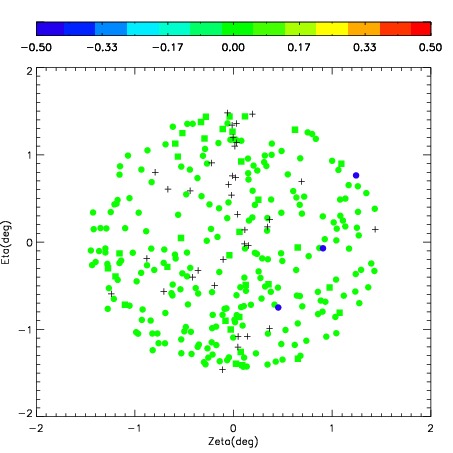


| Frame | Nreads | Zeropoints | Mag plots | Spatial mag deviation | Spatial sky 16325A emission deviations (filled: sky, open: star) | Spatial sky continuum emission | Spatial sky telluric CO2 absorption deviations (filled: H < 10) | |||||||||||||||||||||||
| 0 | 0 |
|
|
|
|
|
|
| IPAIR | NAME | SHIFT | NEWSHIFT | S/N | NAME | SHIFT | NEWSHIFT | S/N |
| 0 | 08440041 | 0.497452 | 0.00000 | 256.758 | 08440040 | 0.0469550 | 0.450497 | 256.573 |
| 1 | 08440042 | 0.495438 | 0.00201398 | 269.836 | 08440036 | 0.00000 | 0.497452 | 270.168 |
| 2 | 08440037 | 0.486812 | 0.0106400 | 264.560 | 08440043 | 0.0376067 | 0.459845 | 269.380 |
| 3 | 08440038 | 0.495208 | 0.00224400 | 256.550 | 08440039 | 0.0470022 | 0.450450 | 252.467 |