| Red | Green | Blue | |
| z | 17.64 | ||
| znorm | Inf | ||
| sky | -Inf | -Inf | -Inf |
| S/N | 24.5 | 45.4 | 48.9 |
| S/N(c) | 0.0 | 0.0 | 0.0 |
| SN(E/C) |


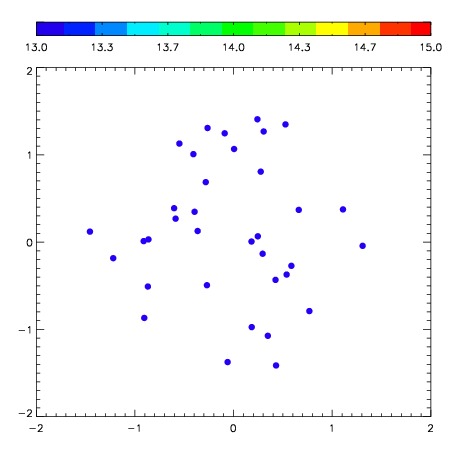
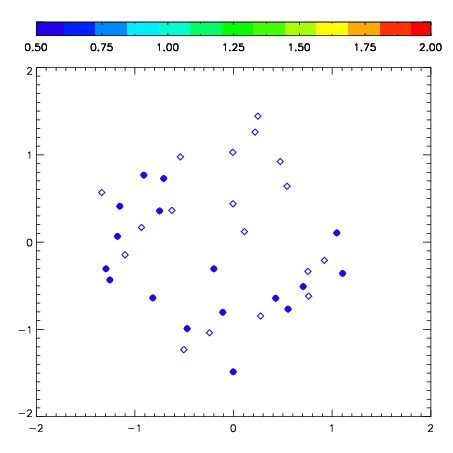
| Frame | Nreads | Zeropoints | Mag plots | Spatial mag deviation | Spatial sky 16325A emission deviations (filled: sky, open: star) | Spatial sky continuum emission | Spatial sky telluric CO2 absorption deviations (filled: H < 10) | |||||||||||||||||||||||
| 0 | 0 |
|
|
|
|
|
|
| IPAIR | NAME | SHIFT | NEWSHIFT | S/N | NAME | SHIFT | NEWSHIFT | S/N |
| 0 | 07910066 | 0.465788 | 0.00000 | 230.435 | 07910063 | 0.00637782 | 0.459410 | 228.295 |
| 1 | 07910061 | 0.455229 | 0.0105590 | 235.601 | 07910060 | 0.00000 | 0.465788 | 241.020 |
| 2 | 07910065 | 0.455148 | 0.0106400 | 234.522 | 07910064 | 0.00759152 | 0.458196 | 237.086 |
| 3 | 07910062 | 0.455344 | 0.0104440 | 231.158 | 07910067 | 0.0118863 | 0.453902 | 229.057 |