| Red | Green | Blue | |
| z | 17.64 | ||
| znorm | Inf | ||
| sky | -NaN | -NaN | -Inf |
| S/N | 23.1 | 41.4 | 43.8 |
| S/N(c) | 0.0 | 0.0 | 0.0 |
| SN(E/C) |

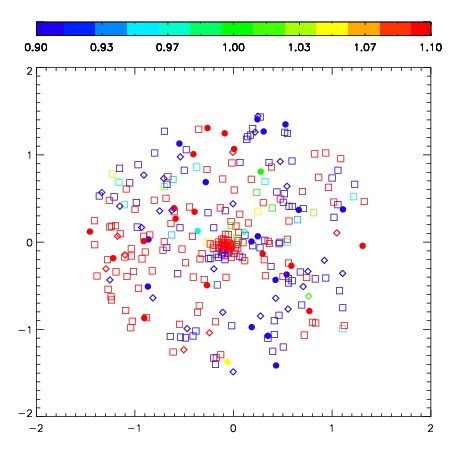
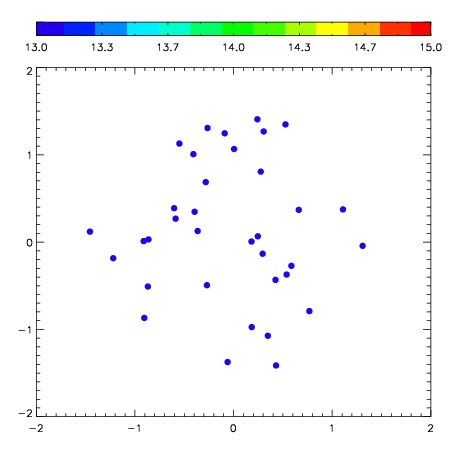
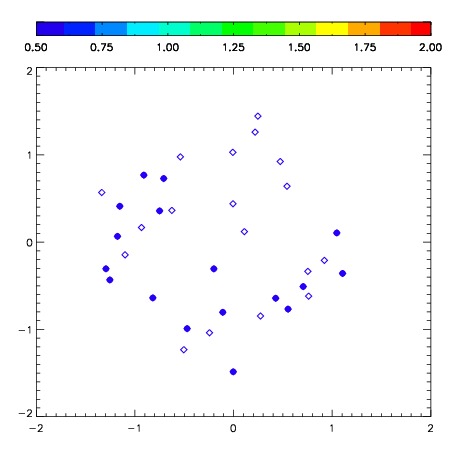
| Frame | Nreads | Zeropoints | Mag plots | Spatial mag deviation | Spatial sky 16325A emission deviations (filled: sky, open: star) | Spatial sky continuum emission | Spatial sky telluric CO2 absorption deviations (filled: H < 10) | |||||||||||||||||||||||
| 0 | 0 |
|
|
|
|
|
|
| IPAIR | NAME | SHIFT | NEWSHIFT | S/N | NAME | SHIFT | NEWSHIFT | S/N |
| 0 | 08140087 | 0.466151 | 0.00000 | 236.575 | 08140088 | -0.00241506 | 0.468566 | 243.714 |
| 1 | 08140086 | 0.453253 | 0.0128980 | 234.426 | 08140085 | -0.00269970 | 0.468851 | 218.878 |
| 2 | 08140082 | 0.454618 | 0.0115330 | 210.057 | 08140081 | 0.00000 | 0.466151 | 211.952 |
| 3 | 08140083 | 0.465091 | 0.00106001 | 184.275 | 08140084 | -0.00329080 | 0.469442 | 205.617 |