| Red | Green | Blue | |
| z | 17.64 | ||
| znorm | Inf | ||
| sky | -Inf | -Inf | -Inf |
| S/N | 26.2 | 42.1 | 48.1 |
| S/N(c) | 0.0 | 0.0 | 0.0 |
| SN(E/C) |

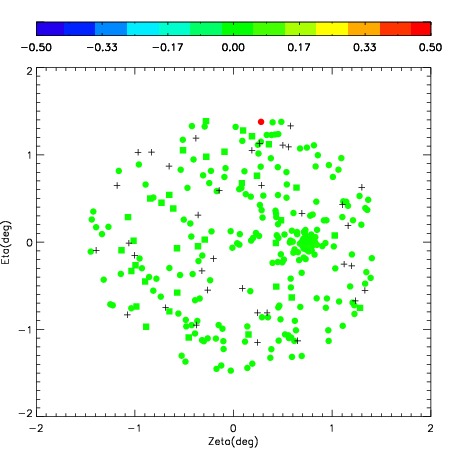
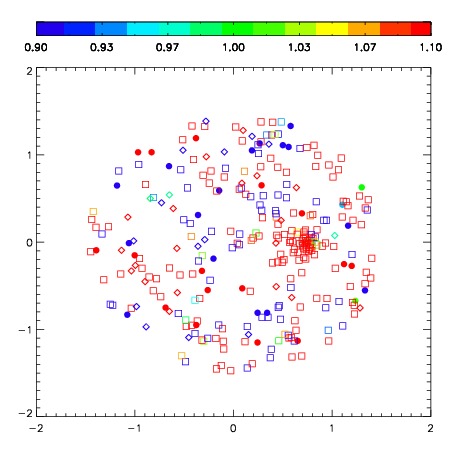


| Frame | Nreads | Zeropoints | Mag plots | Spatial mag deviation | Spatial sky 16325A emission deviations (filled: sky, open: star) | Spatial sky continuum emission | Spatial sky telluric CO2 absorption deviations (filled: H < 10) | |||||||||||||||||||||||
| 0 | 0 |
|
|
|
|
|
|
| IPAIR | NAME | SHIFT | NEWSHIFT | S/N | NAME | SHIFT | NEWSHIFT | S/N |
| 0 | 08490043 | 0.597678 | 0.00000 | 246.662 | 08490044 | 0.0854033 | 0.512275 | 243.085 |
| 1 | 08490042 | 0.588656 | 0.00902200 | 245.955 | 08490040 | 0.0882651 | 0.509413 | 238.947 |
| 2 | 08490039 | 0.587414 | 0.0102640 | 243.628 | 08490041 | 0.0980140 | 0.499664 | 236.148 |
| 3 | 08490038 | 0.591624 | 0.00605398 | 238.667 | 08490037 | 0.00000 | 0.597678 | 227.925 |